
What Is the Margin of Error Calculator?
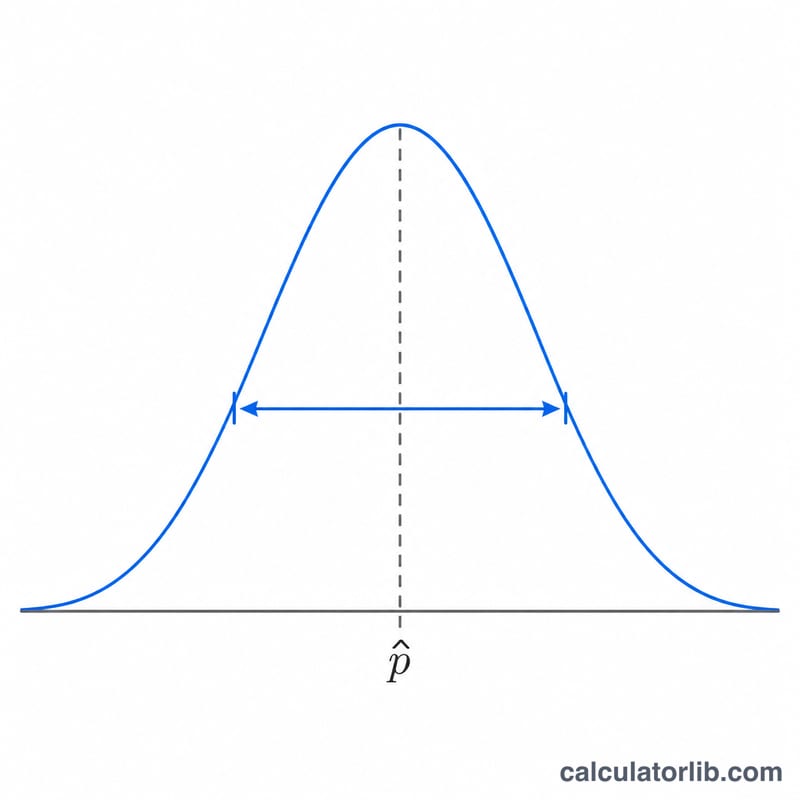
The Margin of Error Calculator tells you how much your survey or poll result is likely to vary from the true value in the whole population. When you sample only a portion of a group, your estimate carries some uncertainty — the margin of error quantifies that uncertainty as a plus-or-minus percentage. This tool turns three simple inputs into a precise margin and a confidence interval around your reported figure.
The Inputs You Provide
- Sample Size: the number of people or items you actually surveyed (for example, 1,000 respondents).
- Confidence Level (%): how sure you want to be that the true value falls within your interval — commonly 90, 95, or 99.
- Sample Proportion (%): the percentage in your sample who gave a particular answer (for example, 60% said "yes").
The Formula It Uses
The calculator applies the standard formula for the margin of error of a proportion:
$$\text{MOE} = z \cdot \sqrt{\frac{p\,(1-p)}{n}} \times 100$$
- \(z\) is the critical value from the normal distribution, found from your confidence level. The tool computes it as the inverse cumulative probability of \(1 - (1 - \text{confidence}/100) / 2\) — so 95% gives \(z \approx 1.96\).
- \(p\) is your sample proportion expressed as a decimal (60% becomes 0.60).
- \(n\) is the sample size.
It then reports a confidence interval: the lower bound (proportion − MOE, never below 0%) and the upper bound (proportion + MOE, never above 100%).
Worked Example
Suppose you survey 1,000 people, want a 95% confidence level, and 60% answered "yes".
- \(z = 1.96\), \(p = 0.60\), \(n = 1{,}000\)
- Standard error $$= \sqrt{\frac{0.60 \times 0.40}{1000}} = \sqrt{0.00024} \approx 0.01549$$
- $$\text{MOE} = 1.96 \times 0.01549 \times 100 \approx 3.04\%$$
So the result is 60% ± 3.04%, giving a confidence interval of roughly 56.96% to 63.04%.
Frequently Asked Questions
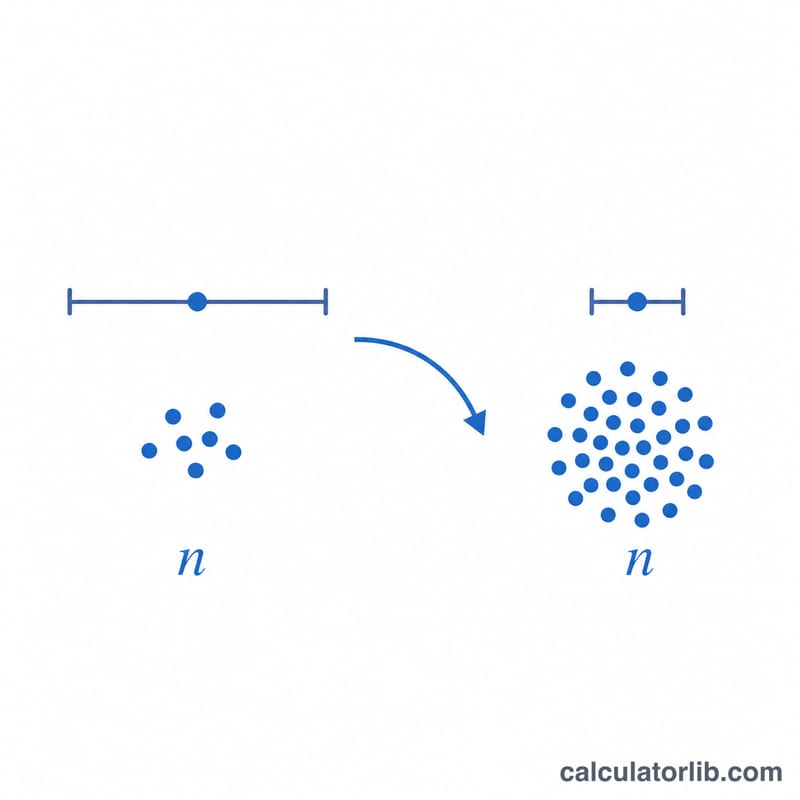
How can I shrink the margin of error? Increase your sample size. Because \(n\) sits under a square root, you must roughly quadruple the sample to halve the margin.
Which proportion gives the largest margin? A proportion of 50% produces the widest margin, because \(p(1 - p)\) is maximised there. If you don't know your proportion yet, using 50% gives a conservative estimate.
Why does a higher confidence level widen the interval? A higher confidence level raises the \(z\) value (95% uses 1.96, 99% uses about 2.58), so the interval grows to give you more certainty of capturing the true value.