What this calculator does
When a TV rating (audience share) is measured, it is not measured on every household — it is estimated from a sample of monitored households. The reported number is therefore a statistical estimate with uncertainty. This calculator takes the observed sample rating and tells you the range in which the true rating of the whole population most likely lies, at a chosen confidence level. Although the example uses TV ratings, the math is universal: it works for any proportion estimated from a sample, such as opinion-poll support rates or quality-control defect rates.
How to use it
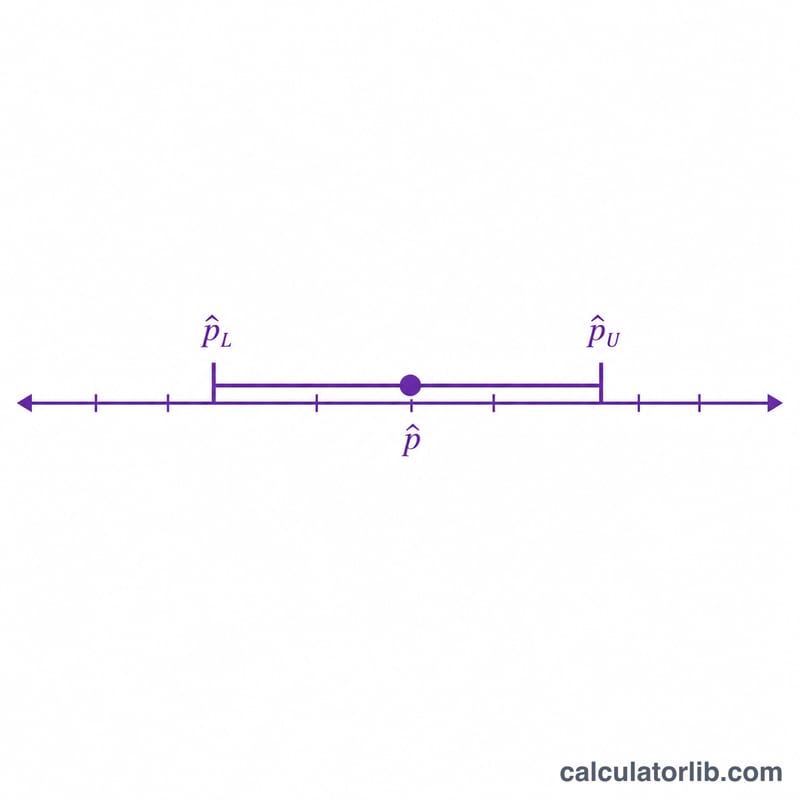
Enter the sample size (the number of households or units surveyed), the sample rating you observed as a percentage, and your desired confidence level (90%, 95% or 99%). The result shows the estimated lower and upper bounds of the true rating, plus the margin of error (the half-width of the interval).
The formula explained
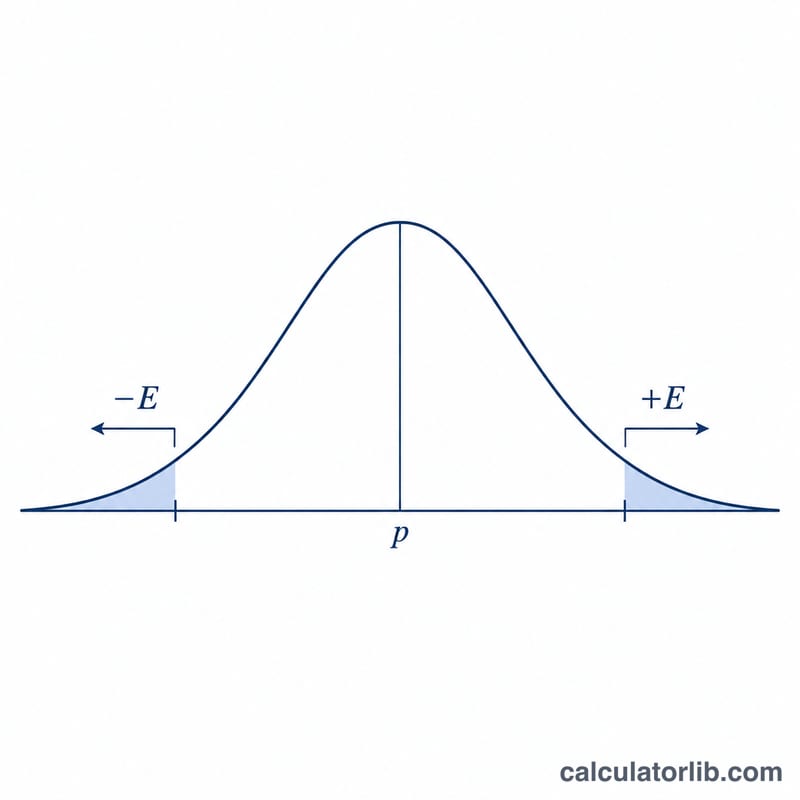
The observed rating is converted to a proportion \(p = \text{rating} / 100\). The standard error of that proportion is \(SE = \sqrt{p(1-p)/n}\). The critical value \(z\) is the two-sided value of the inverse standard normal distribution for the chosen confidence (about 1.6449 for 90%, 1.9600 for 95%, and 2.5758 for 99%). The margin of error is $$E = z \times SE$$ and the confidence interval is \((p - E,\ p + E)\), multiplied back by 100 to show as a percent. Bounds are clamped to the valid 0%-100% range.
Worked example
With \(n = 600\) households, an observed rating of 20%, and 95% confidence: \(p = 0.20\), \(z = 1.9600\), so $$SE = \sqrt{0.20 \times 0.80 / 600} = 0.01633$$ $$E = 1.9600 \times 0.01633 = 0.03201 = 3.20\%$$ The true rating is therefore in the range about 16.80% to 23.20% with a margin of error of \(\pm 3.20\%\).
FAQ
Why is the interval narrower with a bigger sample? Standard error shrinks as \(n\) grows, so more households surveyed means a tighter estimate of the true rating.
Why does a lower confidence level give a narrower range? Lower confidence uses a smaller \(z\), so you trade certainty for precision. 90% confidence yields a tighter but less certain interval than 99%.
What happens at 0% or 100%? The Wald formula gives a zero-width interval there because the standard error becomes 0 — a known limitation of this method. For extreme proportions a Wilson score interval is more reliable.


