What Is the Margin of Error for a Proportion?
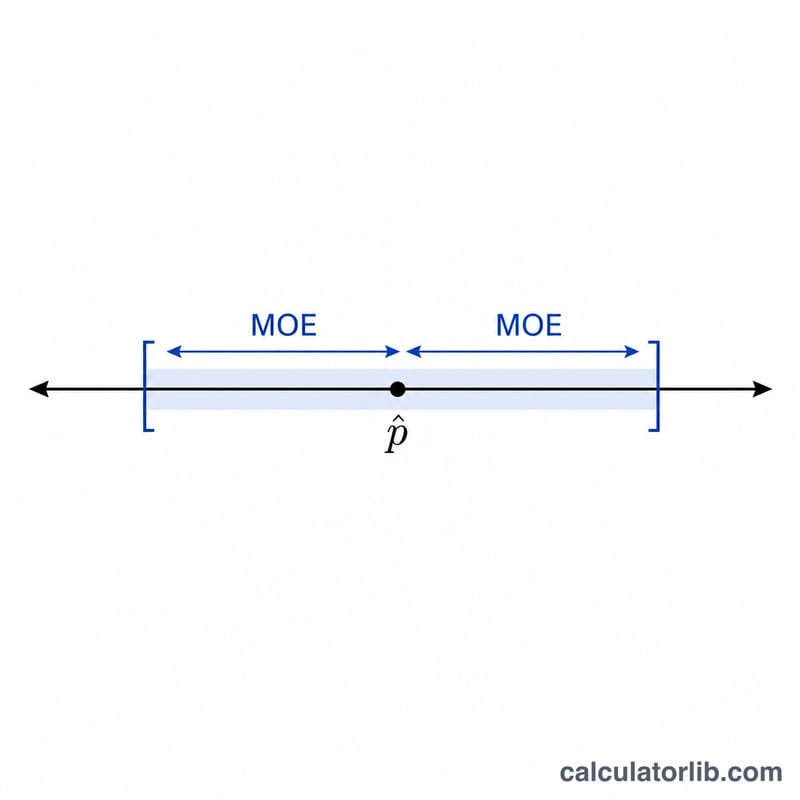
The margin of error (MOE) tells you how much a sample proportion is likely to differ from the true population proportion. When you survey a sample and find that a fraction \(\hat{p}\) of respondents prefer something, the MOE gives the ± range around that estimate at a chosen confidence level. This calculator is universal — it applies to any survey or poll regardless of country.
How to Use It
Enter your sample proportion \(\hat{p}\) as a decimal between 0 and 1 (for example, 0.52 means 52%), enter your sample size \(n\), and choose a confidence level (90%, 95%, or 99%). The tool returns the margin of error as a percentage, the standard error, the \(z\) critical value used, and the resulting confidence interval. It also checks the "five-fold rule" so you know whether the normal approximation is valid.
The Formula Explained
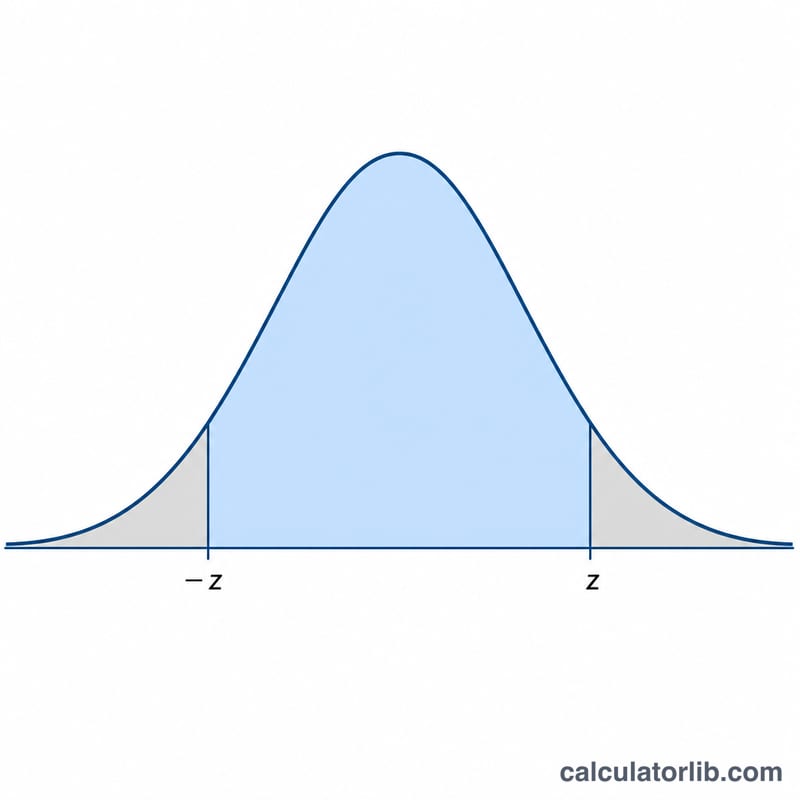
The margin of error is $$\text{MOE} = z \cdot \sqrt{\dfrac{\hat{p}\,\left(1 - \hat{p}\right)}{n}}$$ The term \(\sqrt{\hat{p}(1-\hat{p})/n}\) is the standard error of the proportion — it shrinks as the sample size \(n\) grows. The \(z\) value is the critical value from the standard normal distribution: 1.645 for 90%, 1.96 for 95%, and 2.576 for 99% confidence. Multiplying the standard error by \(z\) scales the interval to the desired level of certainty.
Worked Example
Suppose 52% of 1,000 surveyed voters favor a measure, so \(\hat{p} = 0.52\) and \(n = 1000\), at 95% confidence (\(z = 1.96\)). The standard error is $$\sqrt{\frac{0.52 \cdot 0.48}{1000}} = \sqrt{0.0002496} \approx 0.0158$$ The MOE is $$1.96 \times 0.0158 \approx 0.0310$$ or about 3.1%. The confidence interval is 52% ± 3.1%, roughly 48.9% to 55.1%.
FAQ
What is the five-fold rule? It states that the normal approximation for a proportion is reliable when both \(n \cdot \hat{p} \geq 5\) and \(n \cdot (1-\hat{p}) \geq 5\). If either is below 5, use an exact method like the Clopper–Pearson interval instead.
Why use \(\hat{p} = 0.5\) when unknown? \(\hat{p}(1-\hat{p})\) is largest at 0.5, giving the most conservative (widest) margin of error, which is common in sample-size planning.
Does a larger sample reduce the margin of error? Yes — because \(n\) is in the denominator under the square root, MOE decreases proportionally to \(1/\sqrt{n}\).


