What Is Linear Extrapolation?
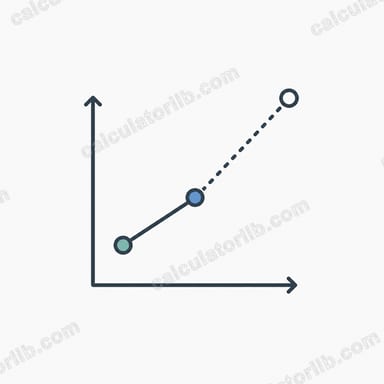
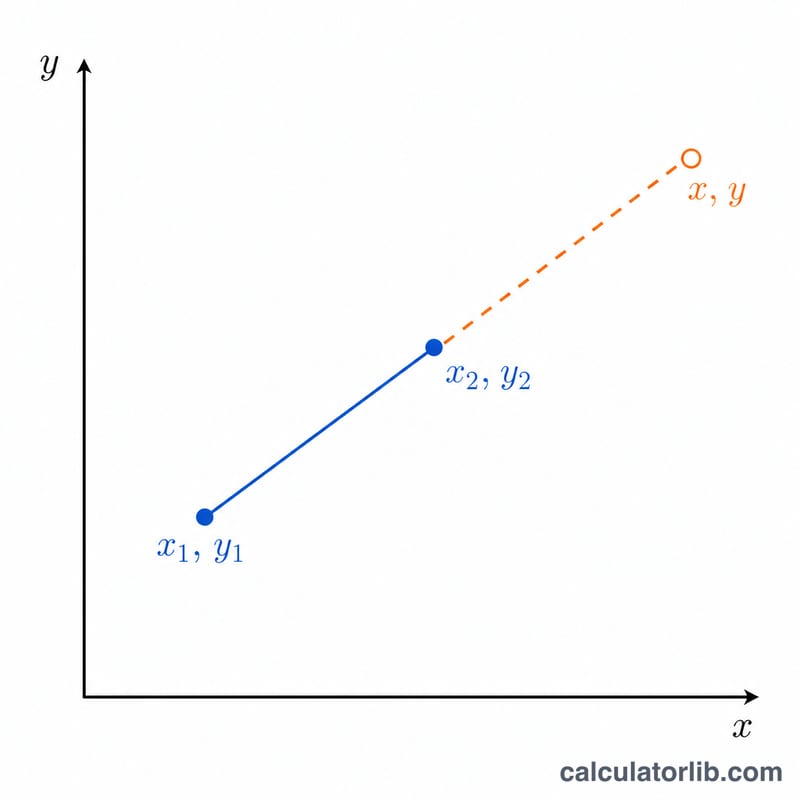
Linear extrapolation estimates an unknown value that lies outside the range of your known data by extending the straight line defined by two points. If you know two points, \((x_1, y_1)\) and \((x_2, y_2)\), you can project the trend forward (or backward) to find y at any chosen x. This calculator does that instantly and also reports the slope of the line.
How to Use This Calculator
Enter the coordinates of your two known points — x₁, y₁ and x₂, y₂ — then type the x value you want to estimate y for. Press calculate and you'll get the extrapolated y value plus the slope of the trend line. The same tool works for interpolation (an x between the points) too, but it is most useful for projecting beyond your data.
The Formula Explained
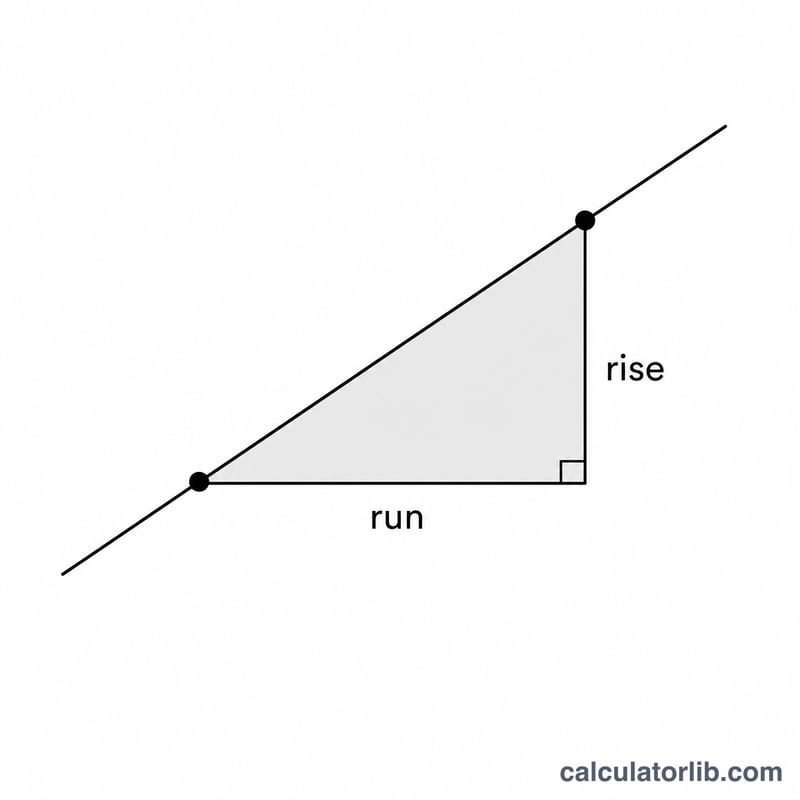
The line through two points has slope \(m = \dfrac{y_2 - y_1}{x_2 - x_1}\). Starting from the first point, the y value at any x is:
$$y = y_1 + \left(x - x_1\right) \cdot \frac{y_2 - y_1}{x_2 - x_1}$$
The term \((x - x_1)\) is how far you move along the x-axis from the first point, and multiplying by the slope tells you how much y changes over that distance.
Worked Example
Suppose sales were 2 units in week 1 (\(x_1=1, y_1=2\)) and 6 units in week 3 (\(x_2=3, y_2=6\)). The slope is $$\frac{6 - 2}{3 - 1} = \frac{4}{2} = 2 \text{ units per week}.$$ To predict week 5 (\(x=5\)): $$y = 2 + (5 - 1)\cdot 2 = 2 + 8 = \textbf{10 units}.$$
FAQ
What's the difference between interpolation and extrapolation? Interpolation estimates within the known range; extrapolation projects outside it. The math here is identical, but extrapolation carries more uncertainty.
Why is extrapolation risky? It assumes the linear trend continues unchanged. Real-world data often curves or shifts, so values far beyond your range can be unreliable.
Can x₁ equal x₂? No — a vertical line has an undefined slope, so the two x values must differ for a valid calculation.