What is linear interpolation?
Linear interpolation estimates an unknown value that lies between two known data points by assuming the relationship between them is a straight line. It is one of the most common techniques in engineering, statistics, finance, and science whenever you have a table of values and need a reading that falls between the listed entries.
How to use this calculator
Enter the coordinates of your two known points: \((x_1, y_1)\) and \((x_2, y_2)\). Then enter the x value you want to evaluate. The calculator returns the interpolated y value along with the slope of the connecting line. The x value may also fall outside the two points, in which case the result is a linear extrapolation.
The formula explained
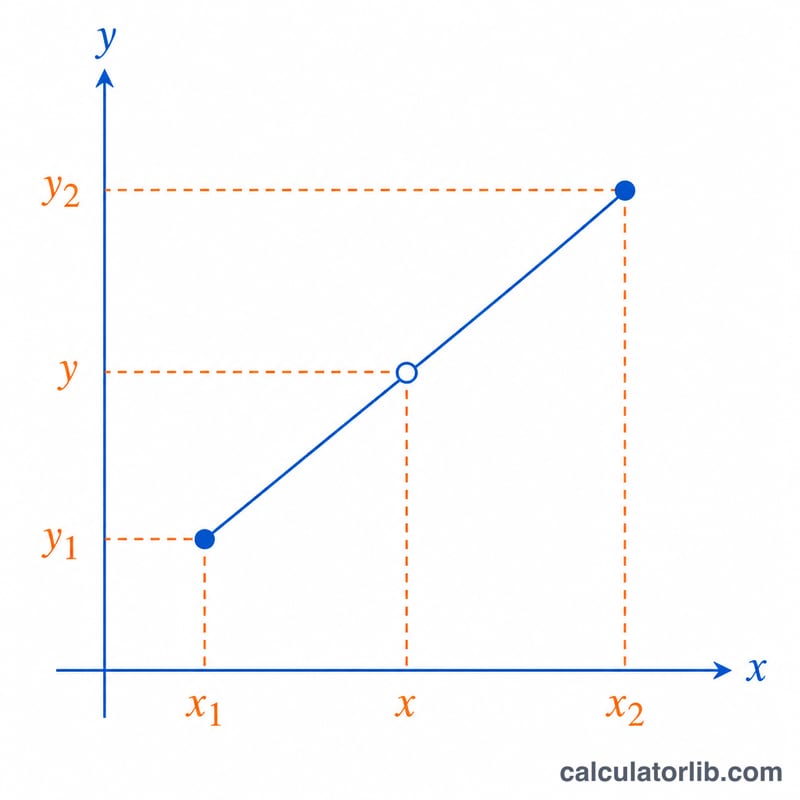
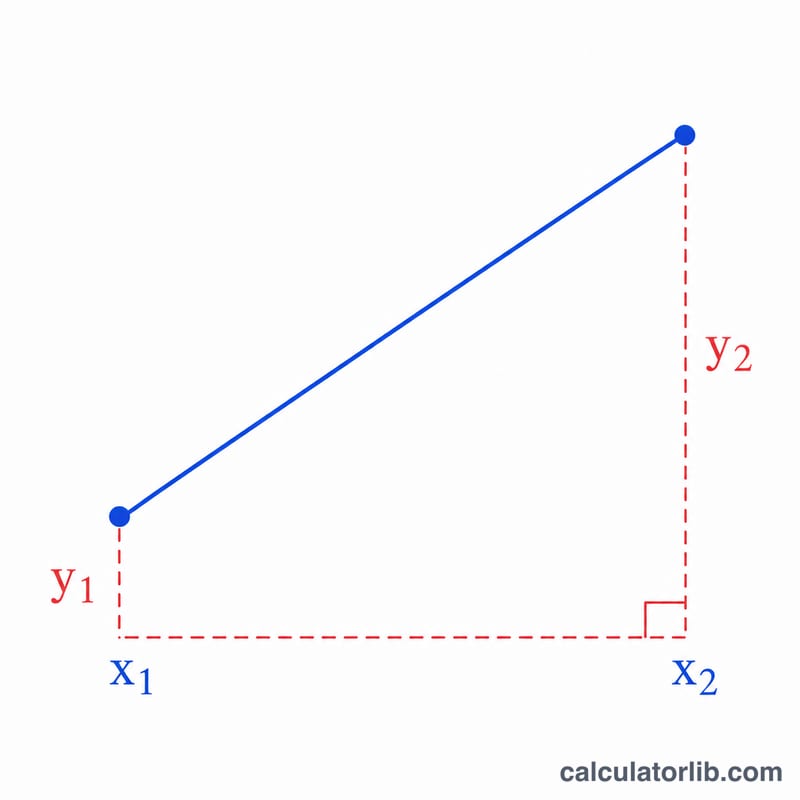
The interpolation formula is $$y = y_1 + \left(x - x_1\right) \cdot \frac{y_2 - y_1}{x_2 - x_1}$$ The fraction \(\frac{y_2 - y_1}{x_2 - x_1}\) is the slope of the line through the two points. Multiplying by \((x - x_1)\) scales that slope by how far x has moved from \(x_1\), and adding \(y_1\) shifts the result to the correct starting height.
Worked example
Suppose you know the point \((1, 2)\) and \((4, 8)\), and want y at \(x = 3\). The slope is $$\frac{8 - 2}{4 - 1} = \frac{6}{3} = 2$$ Then $$y = 2 + (3 - 1) \times 2 = 2 + 4 = 6$$ So the interpolated value is 6.
FAQ
Can x be outside the two points? Yes. If x is below \(x_1\) or above \(x_2\) the formula extrapolates linearly, which assumes the trend continues straight.
What if x₁ equals x₂? The two points share the same x, so the slope is undefined (division by zero). The calculator guards against this and returns \(y_1\).
Is this the same as a trendline? It is a two-point straight line. A regression trendline uses many points; interpolation uses exactly the two you supply.