
What this calculator does
This Dice Fairness Chi-Square Calculator tells you whether a six-sided die is fair (balanced) or biased. You enter how many times each face (1 through 6) appeared, and it runs a Pearson chi-square goodness-of-fit test comparing your observed counts against the uniform expectation. It is pure statistics, so it works the same way anywhere in the world.
How to use it
Roll the die many times and tally the results. Enter the count for each of the six faces. The calculator computes the expected count per face, the chi-square test statistic, and the cumulative (upper-tail) probability that a truly fair die would deviate at least this much. A high probability means the die looks fair; a low probability suggests bias.
The formula explained
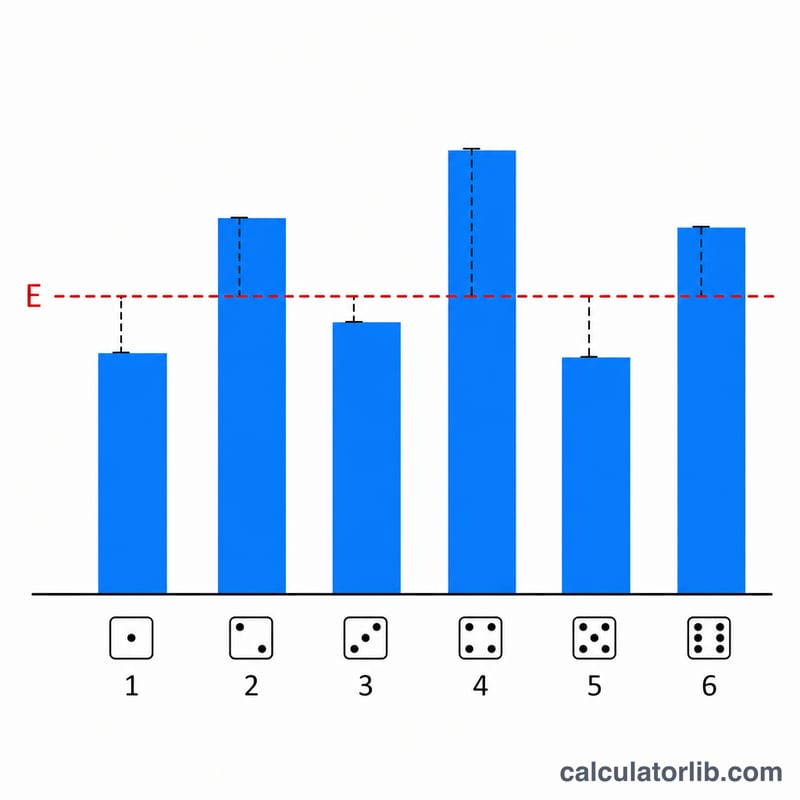
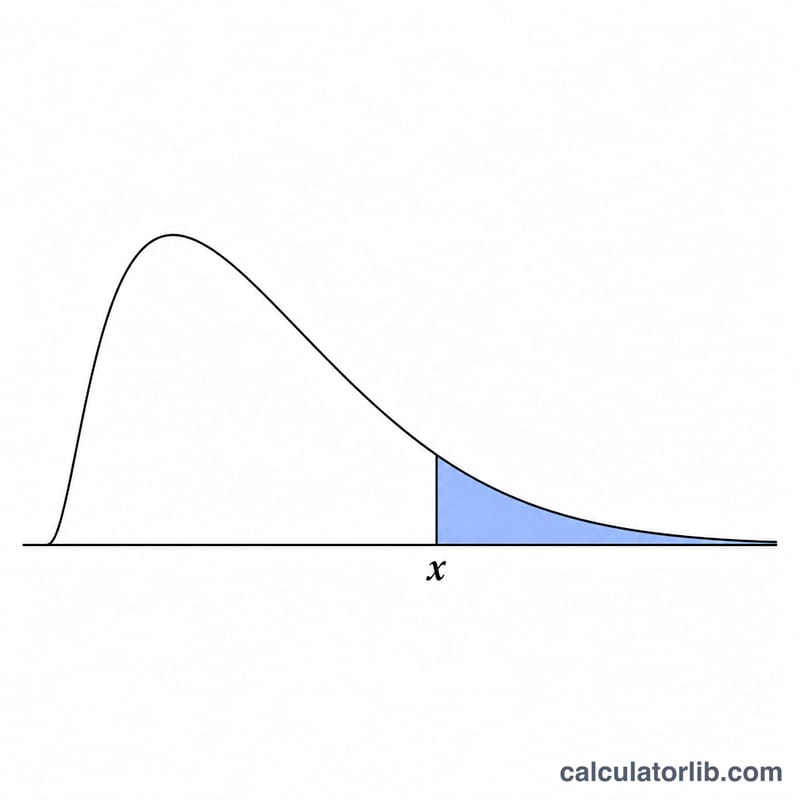
Let N be the total number of rolls and \(k = 6\) faces. The expected count per face is \(E = N / 6\). The test statistic is $$x = \sum \frac{(O_i - E)^2}{E}$$ where \(O_i\) is the observed count for face \(i\). With degrees of freedom \(df = k - 1 = 5\), the cumulative probability is the upper-tail (survival) value of the chi-square distribution: $$P = \operatorname{erfc}\left(\sqrt{x/2}\right) + \sqrt{\frac{2x}{\pi}} \cdot e^{-x/2} \cdot \left(1 + \frac{x}{3}\right)$$ expressed as a percent.
Worked example
Suppose the faces came up [3, 6, 4, 7, 2, 5]. Then \(N = 27\) and \(E = 27/6 = 4.5\). The squared deviations divided by \(E\) sum to about \(3.889\). The upper-tail chi-square probability at \(x = 3.889\) with \(df = 5\) is roughly \(56.6\%\). Since this exceeds \(50\%\), the die can be considered fair.
FAQ
Why does a low number of rolls always look "fair"? Small samples produce small chi-square statistics and large probabilities, so the test is conservative. Roll the die many times (hundreds) for a meaningful result.
What probability counts as unfair? Above \(50\%\) looks fair, \(20\text{–}50\%\) is inconclusive, below \(20\%\) is doubtful, and below \(5\%\) is strong evidence to stop using the die.
Can I use this for other dice? This tool is fixed to six faces (\(df = 5\)). The same method generalizes to \(k\) faces with \(df = k - 1\).


