What this calculator does
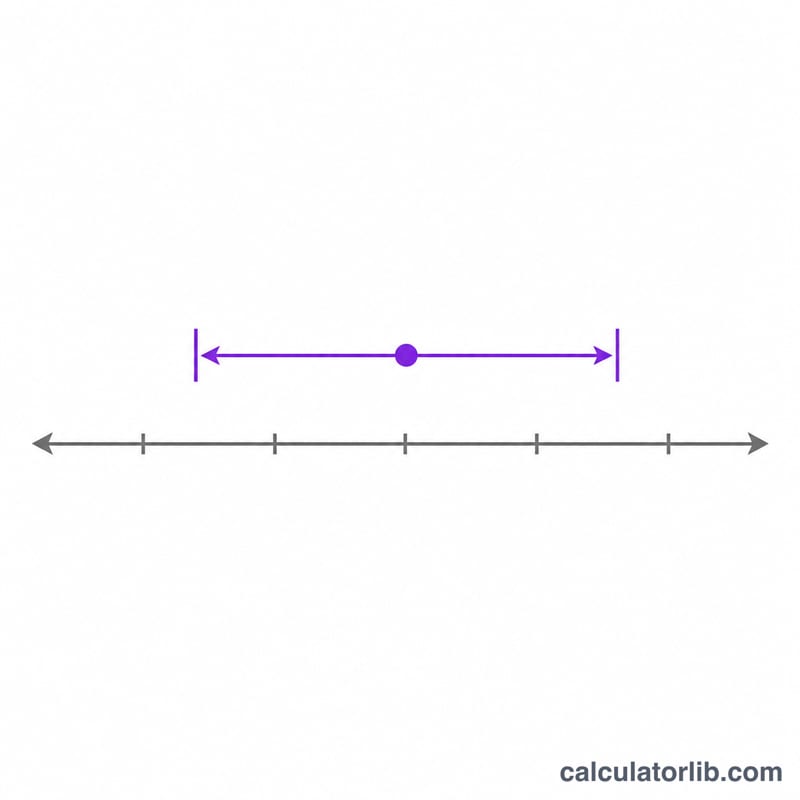
This tool estimates the range in which a "true value" is likely to lie, given a sample mean (\(\mu\)) and a standard deviation (\(\sigma\)). It assumes the quantity follows a normal distribution and reports the symmetric two-sided interval \(\mu \pm z\cdot\sigma\), where z is the standard-normal critical value for the confidence level you choose. Mean and standard deviation are plain numbers, and the interval is returned in whatever units you supplied.
How to use it
Enter your mean, your standard deviation (must be 0 or greater), and a confidence level as a percent where \(50 < \text{confidence} < 100\) (commonly 95). The calculator converts the percent to a probability p, finds the critical value \(z = \Phi^{-1}\!\left(\frac{1+p}{2}\right)\), and returns the lower and upper bounds. At 100% the interval would be infinite, so the confidence must stay below 100.
The formula explained
For probability \(p = \text{confidence}/100\), the two-sided z value is the standard normal quantile at \((1+p)/2\). For 95% this is \(\Phi^{-1}(0.975) \approx 1.95996\), so the interval is \(\mu \pm 1.96\sigma\). Useful landmarks: 68.26% coverage equals \(\mu \pm 1\sigma\), 95.45% equals \(\mu \pm 2\sigma\), and 99.73% equals \(\mu \pm 3\sigma\). The inverse normal CDF is computed with a rational (Acklam) approximation plus a Halley refinement step, so no lookup table is needed.
$$\text{CI} = \text{Mean }\mu \pm z \cdot \text{SD }\sigma \\[1.5em] \text{where}\quad z = \Phi^{-1}\!\left(\frac{1 + \frac{\text{Confidence }\%}{100}}{2}\right)$$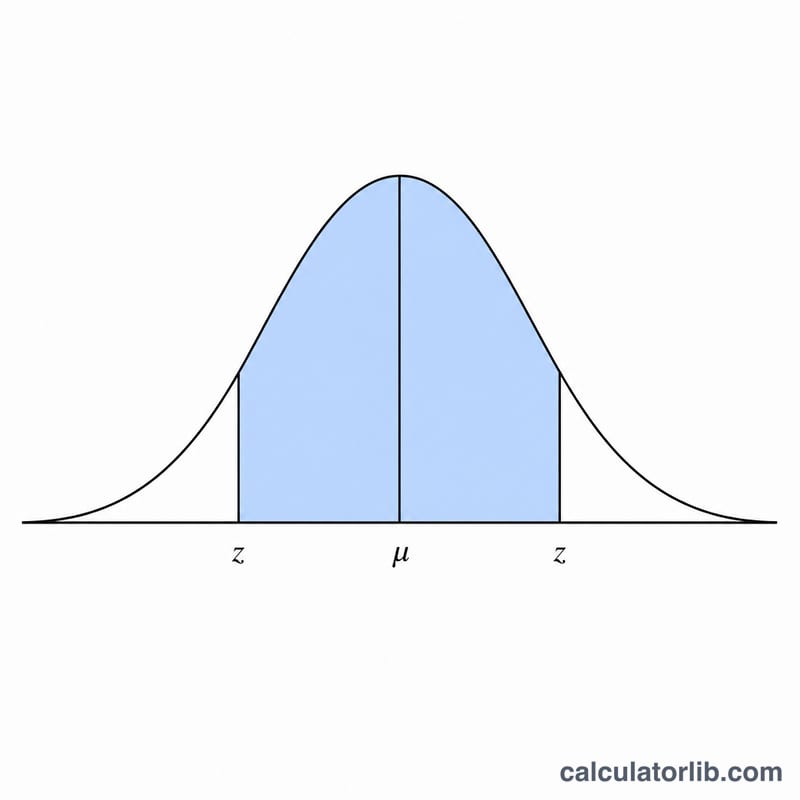
Worked example
With mean = 100, sd = 5 and confidence = 99%: \(p = 0.99\), \(z = \Phi^{-1}(0.995) \approx 2.57583\).
$$\text{Lower bound} = 100 - 2.57583\cdot 5 = 87.121$$$$\text{upper bound} = 100 + 12.879 = 112.879$$The result reads "between 87.12 and 112.88".
FAQ
Why does it use 1.96 for 95%, not 1.645? A symmetric two-sided interval splits the remaining 5% into two tails of 2.5% each, giving \(\Phi^{-1}(0.975) \approx 1.96\). The value 1.645 is the one-sided 95% quantile and is not correct for a two-sided range.
Should I use the t-distribution instead? When \(\sigma\) is estimated from a small sample, a t-distribution with sample size n (interval \(\text{mean} \pm t\cdot s/\sqrt{n}\)) is more appropriate. This tool deliberately treats \(\sigma\) as a known population value and uses the normal z, so it does not require n.
What if sd = 0? The interval collapses to a single point \([\text{mean}, \text{mean}]\).


