
What This Calculator Does
This tool computes the three key descriptive measures of a binomial distribution: the mean (expected value), the variance, and the standard deviation. A binomial distribution models the number of successes in a fixed number of independent trials, where each trial has the same probability of success. It applies universally to any such setup — coin flips, quality-control sampling, survey responses, or any yes/no experiment repeated n times.
How to Use It
Enter the number of trials n (a positive whole number) and the probability of success p on each trial (a value between 0 and 1). The calculator instantly returns the mean, variance, and standard deviation.
The Formula Explained
For a binomial distribution with parameters n and p:
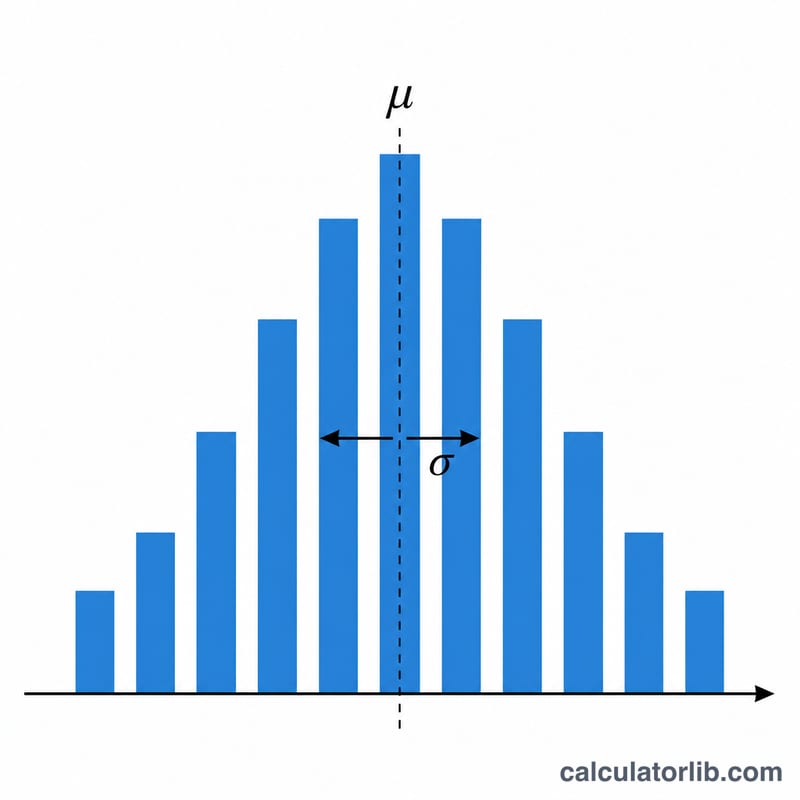
The mean is \(\mu = np\) — the expected number of successes. The variance is \(\sigma^{2} = np(1-p)\), measuring how spread out the outcomes are. The standard deviation is \(\sigma = \sqrt{np(1-p)}\), the square root of the variance, expressed in the same units as the count of successes.
Worked Example
Suppose you flip a fair coin 10 times, so \(n = 10\) and \(p = 0.5\). The mean is $$\mu = 10 \times 0.5 = 5$$ expected heads. The variance is $$\sigma^{2} = 10 \times 0.5 \times 0.5 = 2.5.$$ The standard deviation is $$\sigma = \sqrt{2.5} \approx 1.5811.$$ So you expect about 5 heads, give or take roughly 1.58.
FAQ
What range can p take? Probability \(p\) must be between 0 and 1 inclusive. Values outside that range are clamped.
Why is variance largest at p = 0.5? The product \(p(1-p)\) is maximized when \(p = 0.5\), so uncertainty (spread) peaks there and shrinks toward 0 as \(p\) approaches 0 or 1.
Does this require a large n? No. The formulas \(\mu = np\) and \(\sigma = \sqrt{np(1-p)}\) are exact for any \(n \geq 1\); large \(n\) is only needed if you want to approximate the binomial with a normal distribution.


