What This Calculator Does
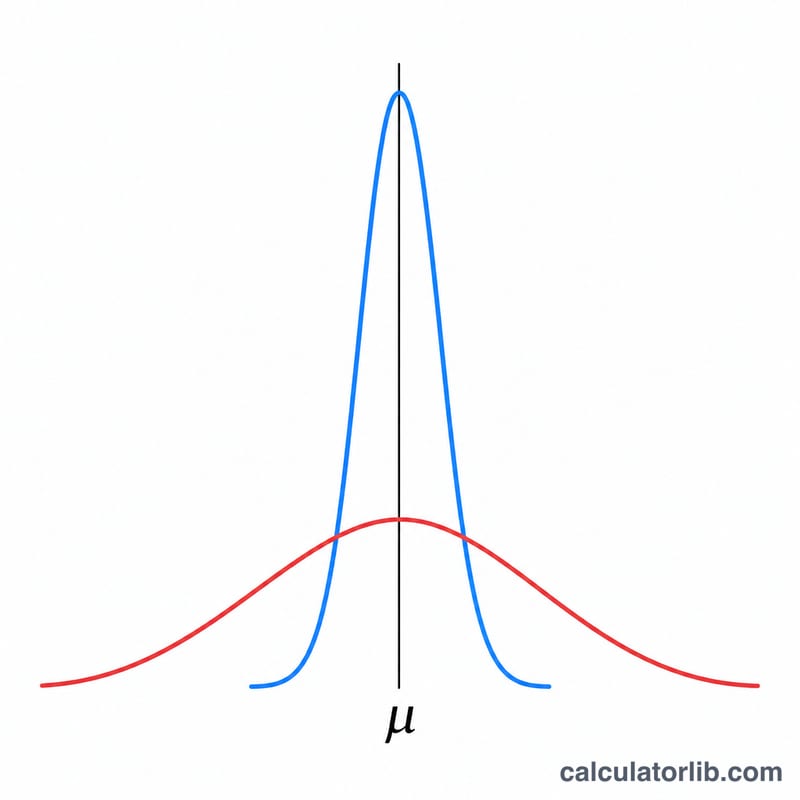
This tool computes the standard deviation and variance of a numeric data set, along with the supporting statistics: count (n), mean, and sum of squares (SS). Standard deviation measures how spread out your numbers are around their average. A small value means the data points cluster tightly near the mean; a large value means they are widely dispersed.
How to Use It
Type or paste your numbers into the box, separated by spaces, commas, or new lines — any mix works, and blank entries are ignored. Then choose whether your data represents a sample (a subset of a larger group, divides by n−1) or the entire population (divides by n). Click calculate to see the full breakdown.
The Formula Explained
First the mean is found: \(\bar{x} = \dfrac{\sum x_i}{n}\). Then each value's deviation from the mean is squared and summed to get the sum of squares: $$SS = \sum (x_i - \bar{x})^2$$ The variance is SS divided by n−1 (sample) or n (population), and the standard deviation is simply the square root of the variance. Sample mode uses n−1 (Bessel's correction) to give an unbiased estimate of the true population variance from a sample.
The sample standard deviation is:
$$s = \sqrt{\dfrac{\sum_{i=1}^{n}(x_i - \bar{x})^2}{n-1}}$$and the population standard deviation is:
$$\sigma = \sqrt{\dfrac{\sum (x_i - \mu)^2}{n}}$$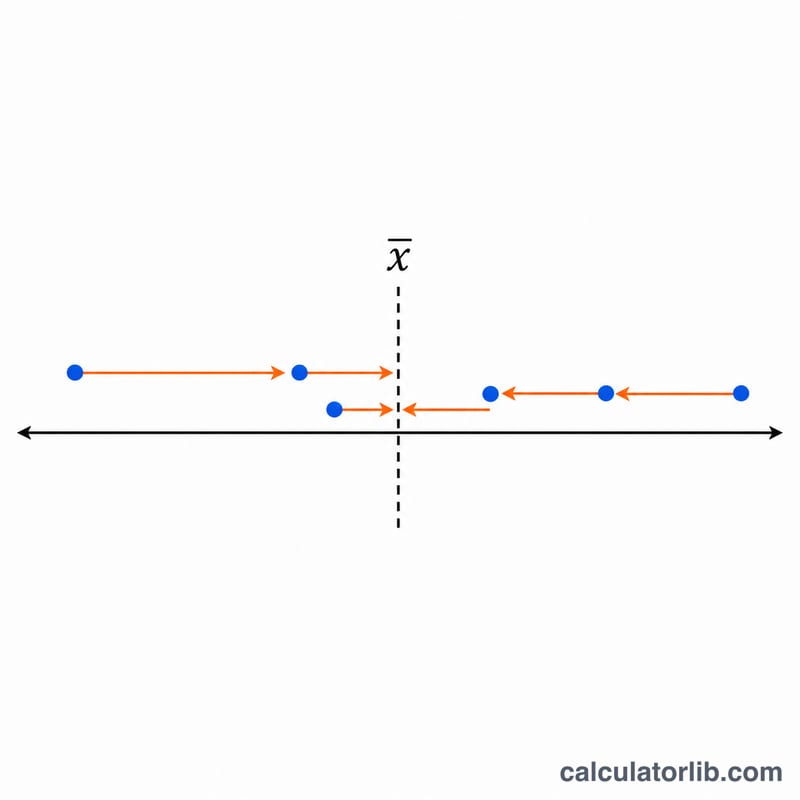
Worked Example
For the data set 10, 12, 23, 23, 16, 23, 21, 16: the sum is 144 and \(n = 8\), so the mean is 18. The squared deviations add up to \(SS = 192\). In sample mode, variance \(= 192 \div 7 = 27.4286\) and standard deviation \(= \sqrt{27.4286} \approx 5.2372\). In population mode, variance \(= 192 \div 8 = 24\) and standard deviation \(= \sqrt{24} \approx 4.899\).
FAQ
When should I use sample vs population? Use sample when your data is a subset drawn from a larger group you want to make inferences about. Use population when your data includes every member of the group.
Why does sample mode need at least 2 values? The sample formula divides by n−1, which would be zero with only one value, making the result undefined.
What is the sum of squares? It is the total of every squared difference between each data point and the mean — the building block of both variance and standard deviation.


