
What is a stem-and-leaf plot?
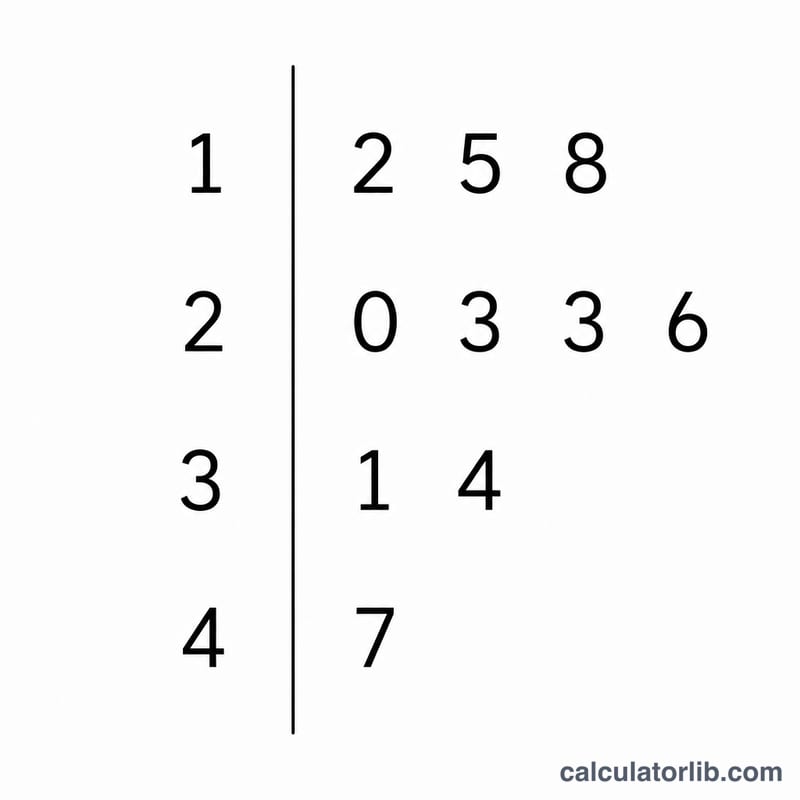
A stem-and-leaf plot (also called a stemplot) is a quick way to organize numerical data so you can see its shape and spread while keeping the original values. Each number is split into a stem (its leading digits) and a leaf (its trailing digits). Stems are listed once in a column, and the leaves for each stem are written beside it in ascending order. The result looks like a sideways histogram that still shows every data point.
How to use this generator
Paste or type your numbers into the data box, separated by commas, spaces, or new lines. Choose how many trailing digits should form each leaf (1 to 4) and, optionally, turn on split stems to break each stem into a low half (leaves 0-4) and a high half (leaves 5-9). The tool draws the plot and computes a panel of descriptive statistics: count, minimum, maximum, range, sum, mean, median, mode, sample variance and sample standard deviation.
The formula explained
For a leaf length \(L\), set the divisor \(D = 10^L\). For a value \(x\), the stem is \(\left\lfloor x / D \right\rfloor\) and the leaf is \(x \bmod D\).
$$\text{stem} = \left\lfloor \frac{x}{10^{L}} \right\rfloor, \quad \text{leaf} = x \bmod 10^{L}$$
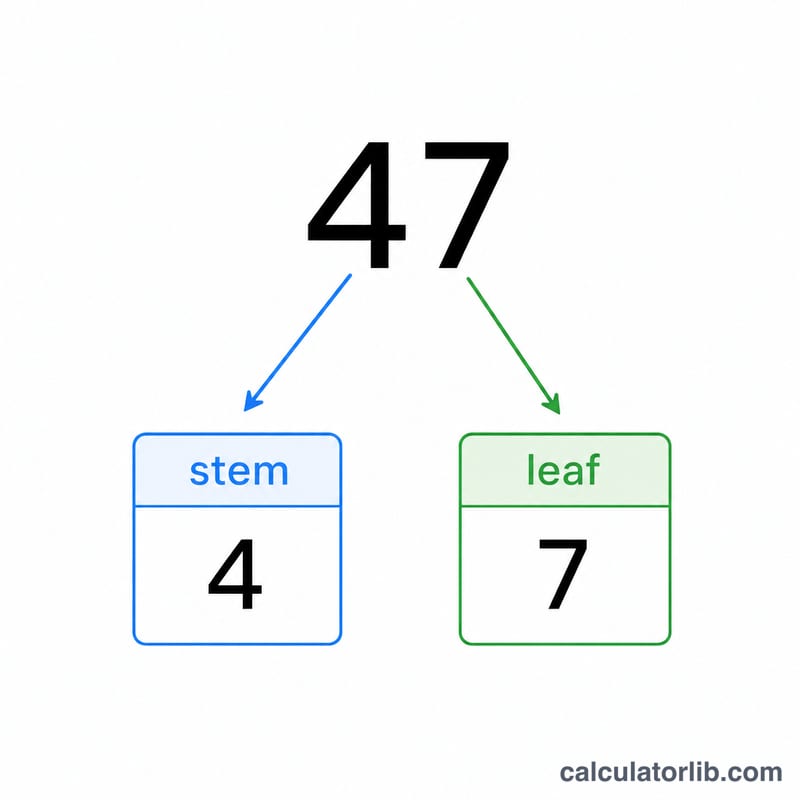
With \(L = 1\) and \(x = 47\), the stem is \(\left\lfloor 47 / 10 \right\rfloor = 4\) and the leaf is \(47 \bmod 10 = 7\), so 47 appears as "4 | 7". Statistics use the sample standard deviation, dividing the sum of squared deviations by \(n - 1\).
$$s = \sqrt{\frac{\sum_{i=1}^{n}(x_i - \bar{x})^2}{n - 1}}$$
Worked example
For the data 22, 25, 26, 33, 35, 36, 38, 42, 45, 45, 46, 47, 47, 47, 48, 48, 49, 52, 54, 56, 58, 58, 65, 68, 69, 74, 75, 87, 99 the count is 29, minimum 22, maximum 99, range 77 and sum 1494. The mean is \(1494 / 29 = 51.52\), the median (15th value) is 48, and the mode is 47 (it appears three times). The sample variance is about 321.5, giving a sample standard deviation near 17.93. The plot starts with 2 | 2 5 6 and 3 | 3 5 6 8.
FAQ
Sample or population standard deviation? This tool reports the sample versions (\(n - 1\) denominator), which are most common in introductory statistics.
What about decimals or negatives? The generator is designed for non-negative integer data; mixed-sign or decimal data may render unconventionally because the stem must carry the sign and integer part.
Why split the stems? Splitting each stem into low and high halves spreads out crowded plots so the distribution's shape is easier to read.