What is a z-score?
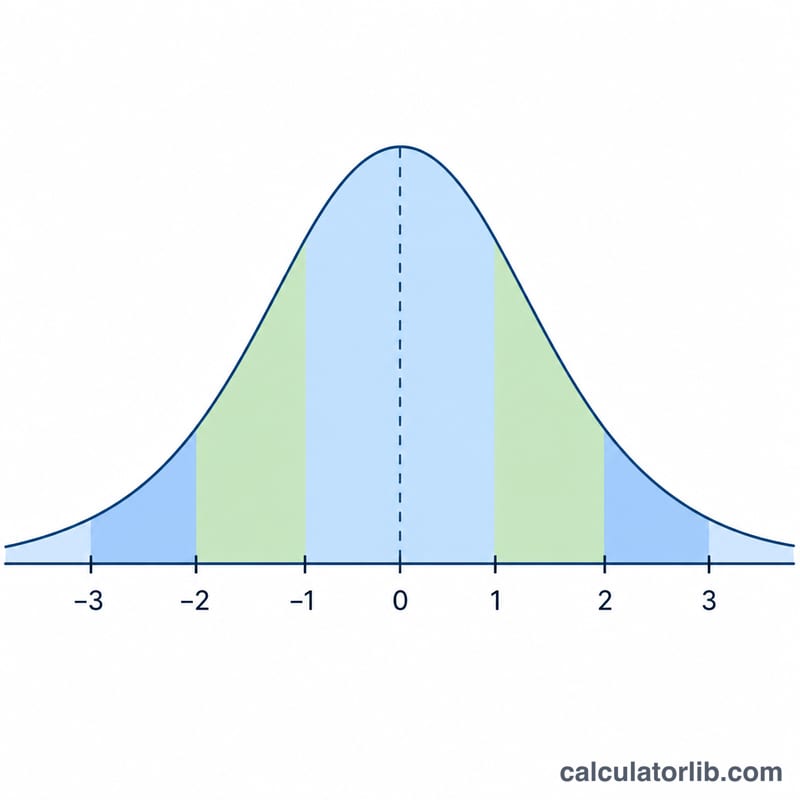
A z-score (also called a standard score or standardized value) tells you how many population standard deviations a value lies from the population mean. A positive z means the value is above the mean, a negative z means it is below the mean, and \(z = 0\) means it is exactly at the mean. Because z-scores are unitless, they let you compare observations measured on completely different scales. This calculator is a pure statistics tool and works identically anywhere.
How to use this calculator
Choose what you want to standardize with the "Calculate z using" selector: a single data point or several points, a known sample mean with its size, or a raw data sample that the tool will average for you. Then enter the population mean (mu) and population standard deviation (sigma). Lists may be separated by commas, spaces, tabs or newlines, so you can paste a spreadsheet column directly.
The formulas
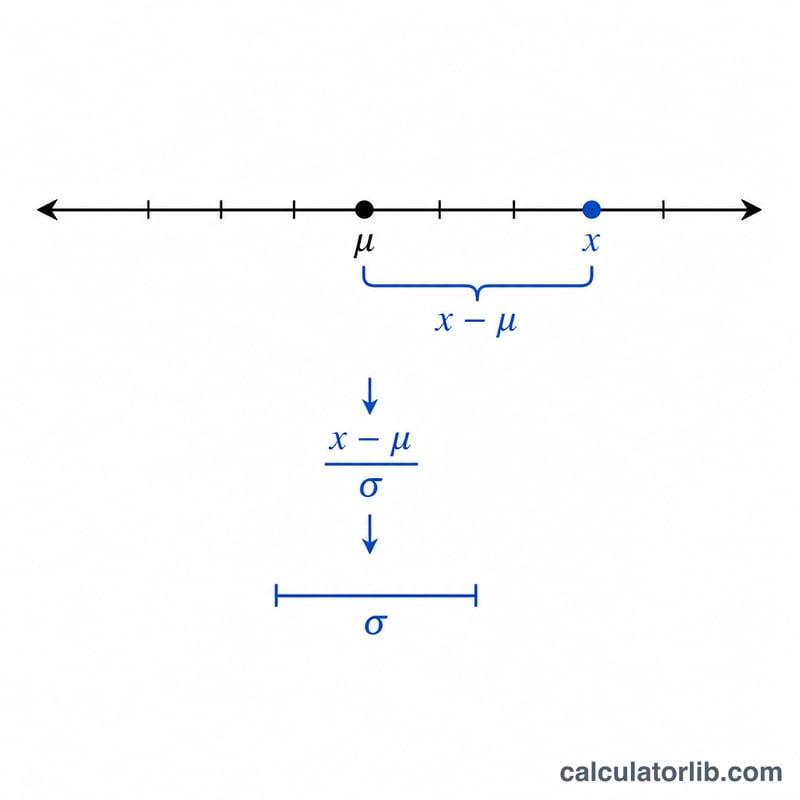
For a single observation the formula is $$z = \frac{x - \mu}{\sigma}$$ For a sample mean the formula uses the standard error of the mean: $$z = \frac{\bar{x} - \mu}{\sigma / \sqrt{n}}$$ where \(\sigma / \sqrt{n}\) is the standard error. In "data sample" mode the calculator first computes the sample mean \(\bar{x} = (\text{sum of values}) / n\), then applies the same standard-error formula.
Worked example
Suppose \(x = 190\), \(\mu = 150\) and \(\sigma = 25\). Then $$z = \frac{190 - 150}{25} = \frac{40}{25} = 1.6$$ meaning 190 sits 1.6 standard deviations above the mean. For a sample mean example with \(\bar{x} = 280\), \(\mu = 300\), \(\sigma = 50\) and \(n = 25\), the standard error is \(50 / \sqrt{25} = 10\), so $$z = \frac{280 - 300}{10} = -2.0$$
FAQ
Can I enter several data points at once? Yes. In "Data point(s)" mode, enter multiple numbers separated by commas or spaces and you will get a z-score for each.
Why must sigma be greater than zero? The z formula divides by sigma (or by the standard error \(\sigma/\sqrt{n}\)). A standard deviation of zero would divide by zero, so the calculator returns an error.
How do I turn a z-score into a percentile? Look the z value up in a standard-normal table or use a cumulative normal function. For example, \(z = 1.6\) corresponds to roughly the 94.52nd percentile.


