
What Is the Chi-Square Test Statistic?
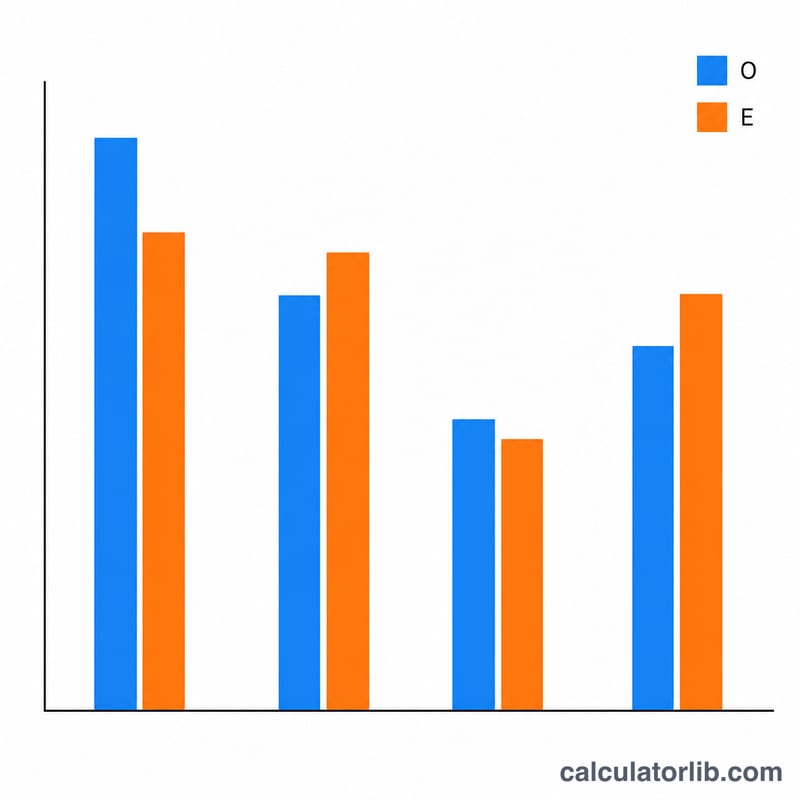
The chi-square (χ²) test statistic measures how far a set of observed frequencies deviates from the frequencies you would expect under a null hypothesis. It is the foundation of the chi-square goodness-of-fit test and the chi-square test of independence. A larger χ² value indicates a greater discrepancy between what was observed and what was expected, providing evidence against the null hypothesis.
How to Use This Calculator
Enter your observed frequencies as a comma-separated list, then enter the matching expected frequencies in the same order. The calculator pairs each observed value with its expected value, computes the contribution of each category, and sums them to produce the overall χ² statistic. It also reports the number of categories (\(k\)) and the degrees of freedom (\(k - 1\)), which you use to look up a critical value or p-value in a chi-square distribution table.
The Formula Explained
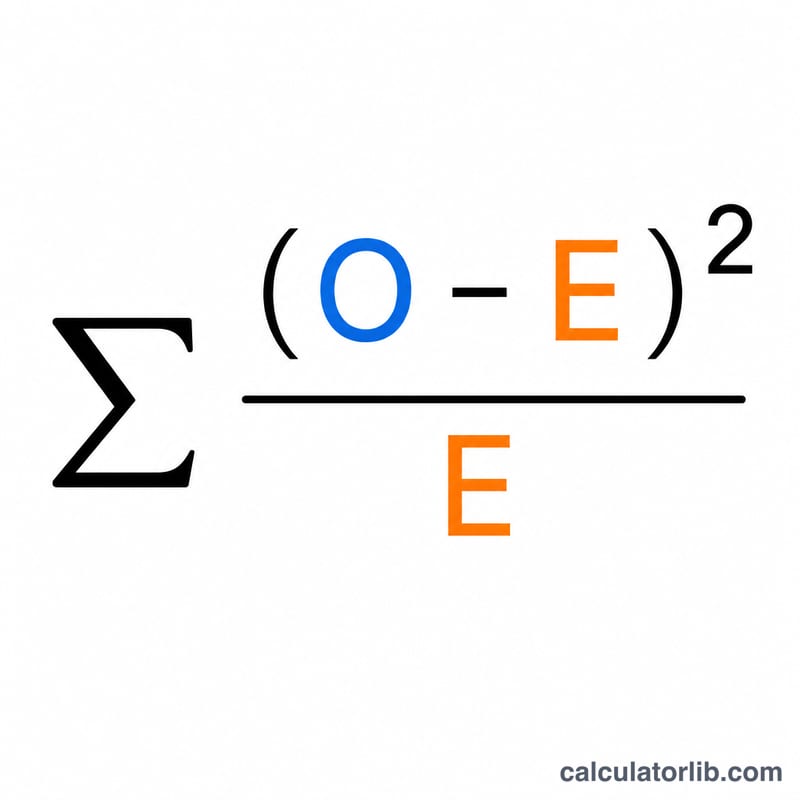
The statistic is $$\chi^{2} = \sum_{i=1}^{k} \frac{\left(\text{O}_i - \text{E}_i\right)^{2}}{\text{E}_i}$$ For each category, you subtract the expected count from the observed count, square the result so positive and negative differences do not cancel, and divide by the expected count to scale the deviation. Summing these category contributions gives the test statistic. Each expected frequency must be greater than zero; categories with an expected value of zero are skipped to avoid division by zero.
Worked Example
Suppose a die is rolled 100 times with observed counts of 30, 20, 25, 25 and equal expected counts of 25 each. The contributions are \((30-25)^{2}/25 = 1\), \((20-25)^{2}/25 = 1\), \((25-25)^{2}/25 = 0\), and \((25-25)^{2}/25 = 0\). Summing gives $$\chi^{2} = 2.0$$ with 4 categories and 3 degrees of freedom.
FAQ
What does a high χ² mean? It signals a large difference between observed and expected data, suggesting the null hypothesis may be false.
How do I get a p-value? Compare the χ² statistic against the chi-square distribution using the reported degrees of freedom, via a table or statistical software.
Do the lists need the same length? Yes — each observed value must have a matching expected value. The calculator pairs them in order.


