
What Is the Chi-Square Calculator?
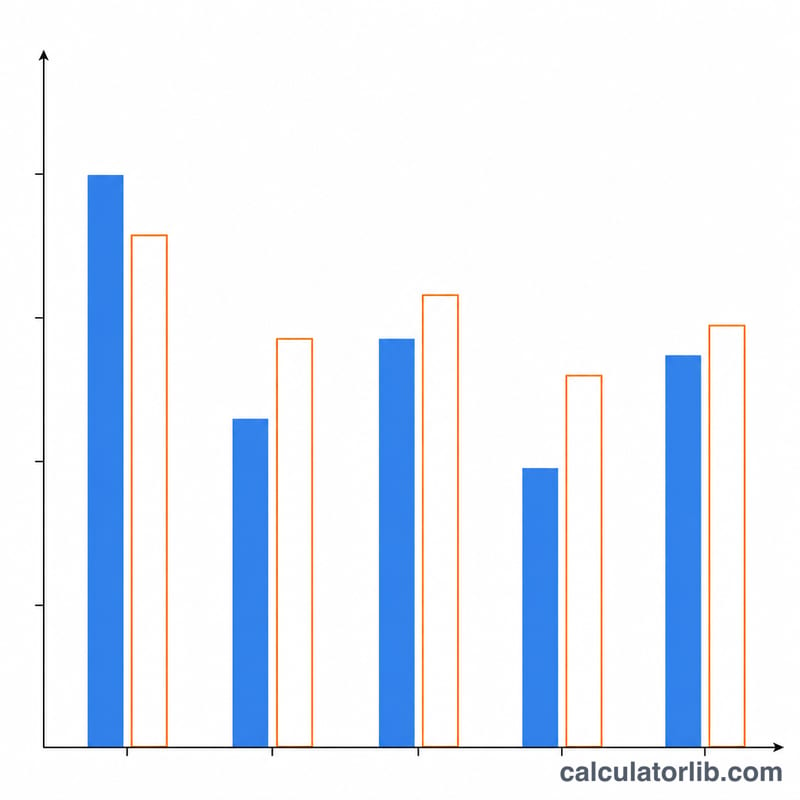
This calculator computes the chi-square (χ²) statistic for a goodness-of-fit test. The chi-square test measures how well a set of observed frequencies matches the frequencies you would expect under a particular hypothesis. A larger χ² indicates a bigger discrepancy between what was observed and what was expected. It is a universal statistical tool used in biology, marketing, genetics, quality control, and the social sciences.
How to Use It
Enter your observed values (O) as a comma-separated list, then enter the matching expected values (E) in the same order. Each pair represents one category. The calculator returns the χ² statistic, the number of categories used, and the degrees of freedom (categories minus one). Compare your χ² to a critical value from a chi-square distribution table at your chosen significance level (e.g. 0.05) to decide whether to reject the null hypothesis.
The Formula Explained
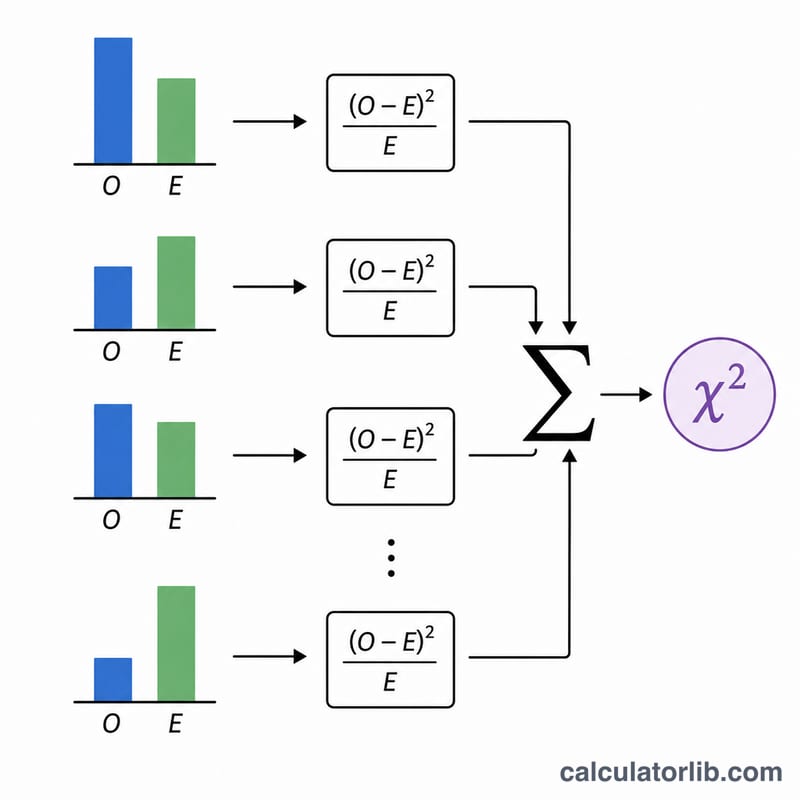
The chi-square statistic is defined as:
$$\chi^2 = \sum_{i=1}^{k} \frac{\left(O_i - E_i\right)^2}{E_i}$$
For each category, subtract the expected value from the observed value, square the result, divide by the expected value, and add up all the terms. Squaring ensures every contribution is positive and penalizes large deviations more heavily.
Worked Example
Suppose you roll a die and expect each face equally. Observed: 90, 60, 110, 40 and expected: 80, 80, 80, 40. The contributions are \((90-80)^2/80 = 1.25\), \((60-80)^2/80 = 5\), \((110-80)^2/80 = 11.25\), and \((40-40)^2/40 = 0\). Summing gives \(\chi^2 = 17.5\) with 3 degrees of freedom.
FAQ
What are degrees of freedom? For a goodness-of-fit test, \(df = \text{number of categories} - 1\).
What does a high χ² mean? A higher value means the observed data deviate more from the expected, suggesting the hypothesis may not fit.
Can expected values be zero? No — dividing by a zero expected frequency is undefined, so those categories are skipped.


