
What Is the Empirical Rule?
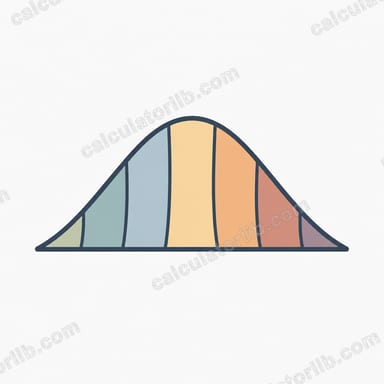
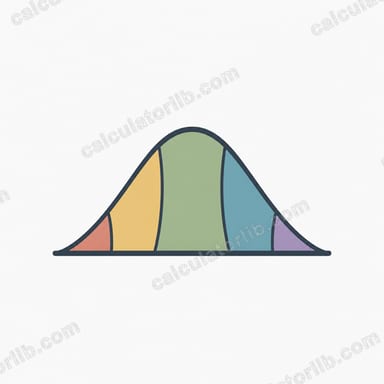
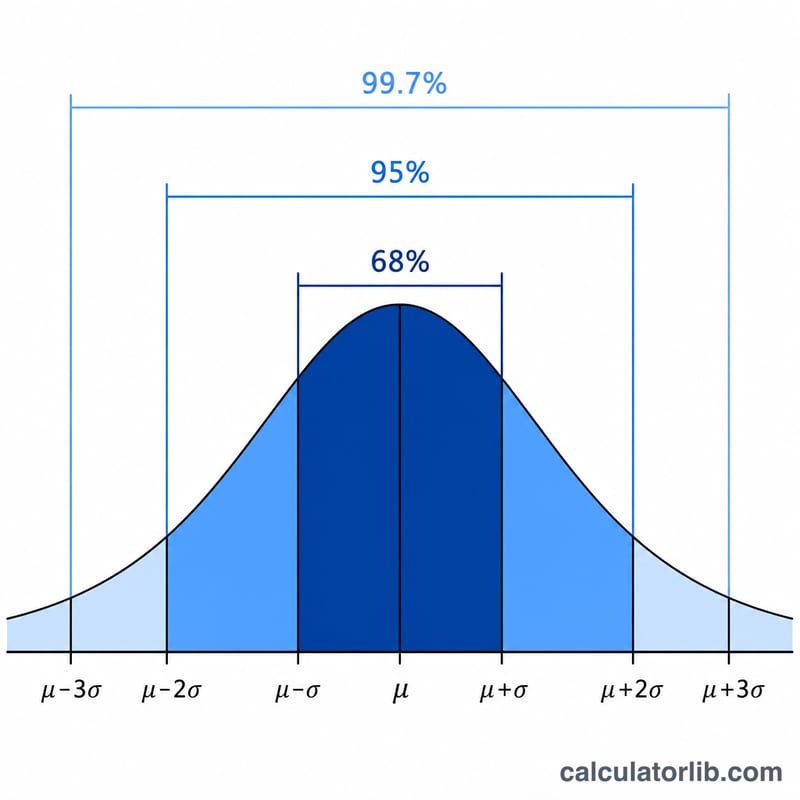
The Empirical Rule — also called the 68-95-99.7 rule or the three-sigma rule — describes how data is distributed in a normal (bell-shaped) distribution. It states that approximately 68% of values fall within one standard deviation of the mean, about 95% fall within two standard deviations, and roughly 99.7% fall within three standard deviations. This calculator instantly converts a mean (\(\mu\)) and standard deviation (\(\sigma\)) into those three intervals.
How to Use This Calculator
Enter the mean of your dataset and its standard deviation, then read off the three ranges. The headline range shows the \(\mu \pm 1\sigma\) interval that captures roughly 68% of observations, and the table expands this to the 95% and 99.7% ranges. The rule only applies to data that is approximately normally distributed.
The Formula Explained
Each range is built from the same simple expression, \(\mu \pm k\sigma\), where \(k\) is 1, 2, or 3. The lower bound is the mean minus \(k\) times the standard deviation and the upper bound is the mean plus \(k\) times the standard deviation. Larger \(k\) values widen the interval and capture a larger share of the data.
$$\mu \pm k\sigma = \text{Mean }(\mu) \pm k \cdot \text{SD }(\sigma), \quad k = 1, 2, 3$$$$\begin{gathered} \mu \pm k\sigma = \text{Mean }(\mu) \pm k \cdot \text{SD }(\sigma) \\[1.5em] \text{where}\quad \left\{ \begin{aligned} 68\% &: \mu \pm 1\sigma \\ 95\% &: \mu \pm 2\sigma \\ 99.7\% &: \mu \pm 3\sigma \end{aligned} \right. \end{gathered}$$
Worked Example
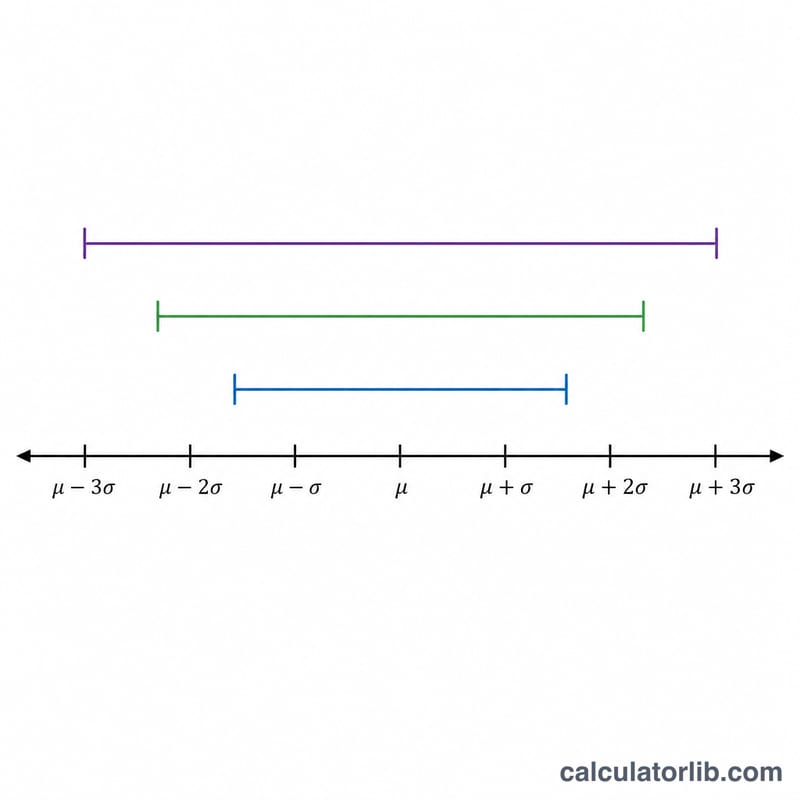
Suppose exam scores are normally distributed with a mean of 100 and a standard deviation of 15. Then 68% of scores fall between 85 and 115 (\(100 \pm 15\)), 95% fall between 70 and 130 (\(100 \pm 30\)), and 99.7% fall between 55 and 145 (\(100 \pm 45\)). So almost every score sits between 55 and 145.
FAQ
Does the Empirical Rule always work? No — it only applies to data that is approximately normal (symmetric and bell-shaped). For skewed data, use Chebyshev's inequality instead.
Why 68, 95, and 99.7 percent? These percentages come from the area under the standard normal curve within 1, 2, and 3 standard deviations of the mean.
What about values beyond 3σ? Only about 0.3% of data lies outside three standard deviations, so such observations are often treated as rare or potential outliers.