
What is the Chi-Square Test of Independence?
The chi-square (\(\chi^2\)) test of independence checks whether two categorical variables are related. For a 2×2 contingency table, it compares the counts you actually observed against the counts you would expect if the two variables were completely independent. A large discrepancy produces a large \(\chi^2\) value and suggests the variables are associated.
How to Use This Calculator
Enter the four cell counts of your 2×2 table: A and B form the first row, C and D form the second row. The calculator adds up the row totals, column totals and grand total, computes the expected count for each cell, and sums the standardized squared deviations to give \(\chi^2\). It also reports the degrees of freedom (always 1 for a 2×2 table), an approximate p-value, the 0.05 critical value, and whether the result is statistically significant.
The Formula Explained
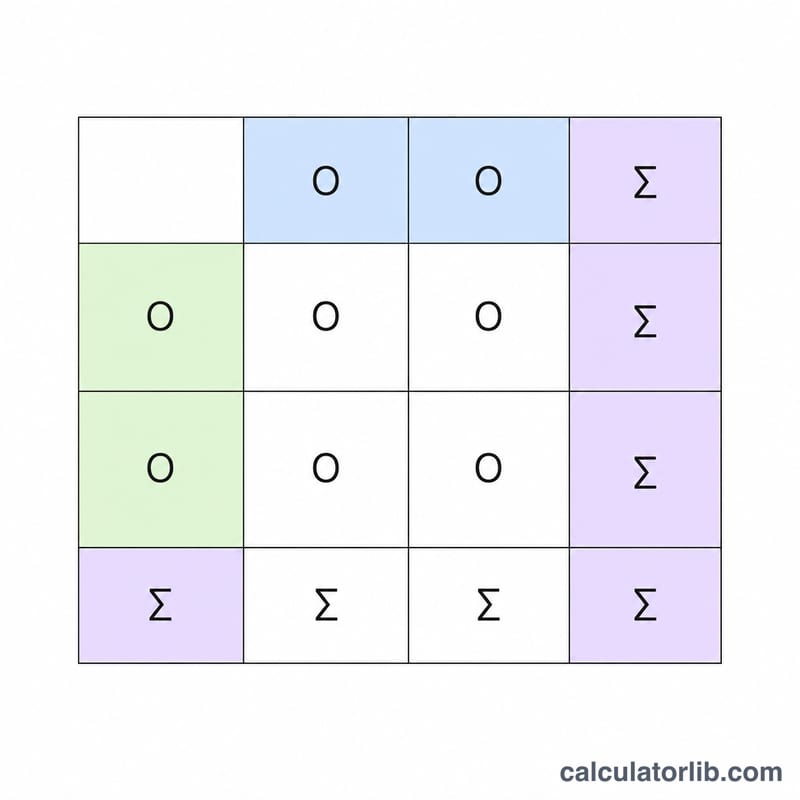
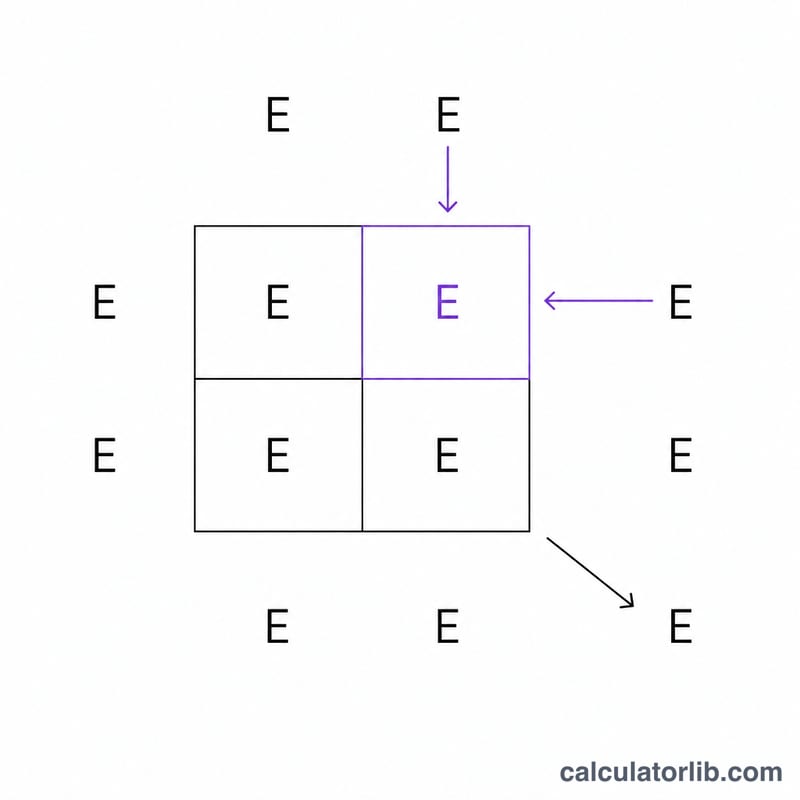
For each cell the expected frequency is \(E = (\text{row total} \times \text{column total}) / \text{grand total}\). The test statistic is $$\chi^2 = \sum \frac{(O - E)^2}{E}$$ across all four cells. With one degree of freedom, the critical value at the 5% significance level is 3.841. If your \(\chi^2\) exceeds 3.841 you reject the null hypothesis of independence.
Worked Example
Suppose \(A = 10\), \(B = 20\), \(C = 30\), \(D = 40\). Row totals are 30 and 70; column totals are 40 and 60; total = 100. Expected values are 12, 18, 28, 42. Then $$\chi^2 = \frac{(10-12)^2}{12} + \frac{(20-18)^2}{18} + \frac{(30-28)^2}{28} + \frac{(40-42)^2}{42} \approx 0.3333 + 0.2222 + 0.1429 + 0.0952 \approx 0.7937$$ Since \(0.79 < 3.841\), we fail to reject independence.
FAQ
Why is df always 1 here? Degrees of freedom = \((\text{rows} - 1)(\text{columns} - 1) = (2-1)(2-1) = 1\).
What does a small p-value mean? A p-value below 0.05 indicates the observed association is unlikely under independence, so the variables are likely related.
Is the p-value exact? It uses a standard numerical approximation of the chi-square distribution with 1 degree of freedom, accurate enough for typical decisions but not a substitute for full statistical software in edge cases.


