What is a p-value?
A p-value is the probability of obtaining a test statistic at least as extreme as the one you observed, assuming the null hypothesis (H₀) is true. Small p-values indicate that your data would be unlikely under H₀, providing evidence against it. This calculator converts a test statistic from the four most common distributions — standard normal (Z), Student's t, chi-square (χ²), and F — into a p-value.
How to use this calculator
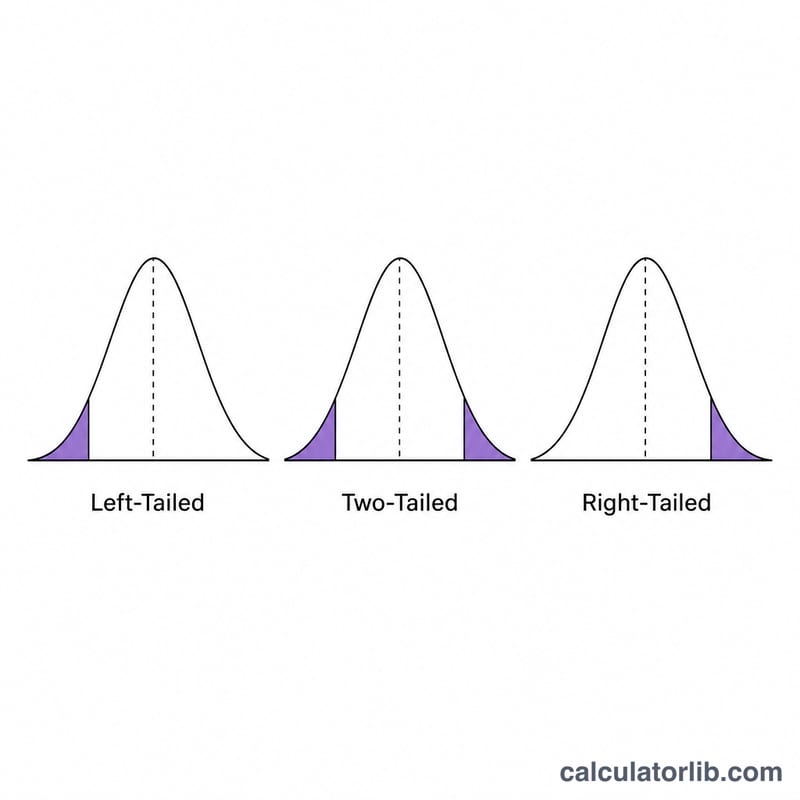
Pick the distribution that matches your test, enter the test statistic, and supply the degrees of freedom where required. The t distribution needs one df value; chi-square needs one df; the F distribution needs both a numerator (df1) and denominator (df2) df. For Z and t you can choose a two-tailed, right-tailed, or left-tailed test. Chi-square and F p-values use the upper (right) tail by convention, which is what nearly all goodness-of-fit and ANOVA tests require.
The formula explained
For a two-tailed Z test the p-value is \(2 \times \left[1 - \Phi\!\left(\left|z\right|\right)\right]\), where \(\Phi\) is the standard normal CDF. The full expression is:
$$p = 2\left[1 - \Phi\!\left(\left|\text{Z}\right|\right)\right]$$For the t distribution the two-tailed p-value equals the regularized incomplete beta function \(I_{\nu/(\nu+t^{2})}\!\left(\nu/2,\ \tfrac{1}{2}\right)\). Chi-square uses the upper regularized incomplete gamma function, and the F distribution uses an incomplete beta with both degrees of freedom. These special functions are computed numerically with continued-fraction and series expansions.
Worked example
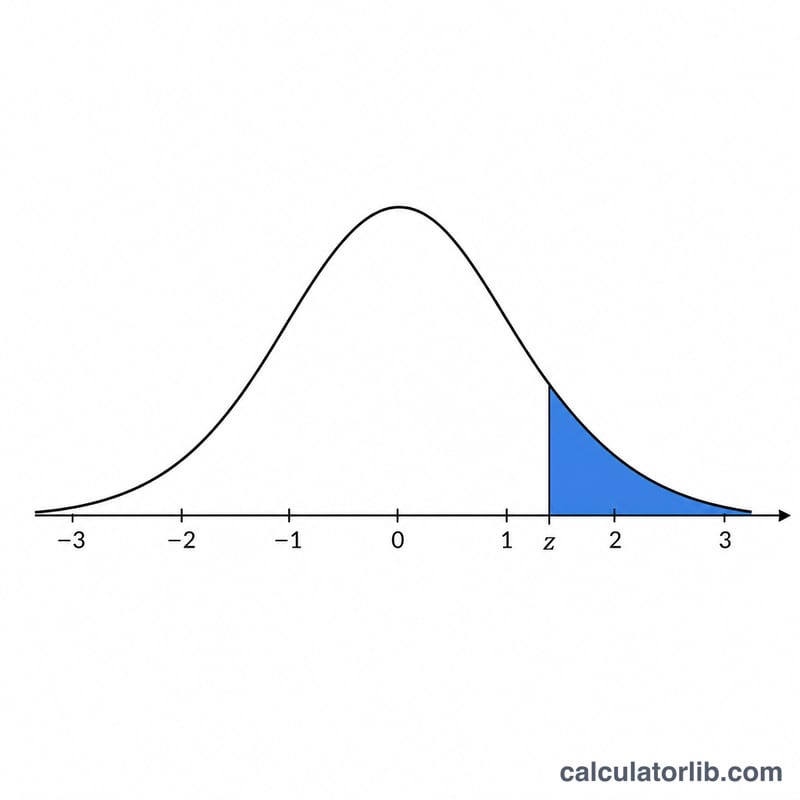
Suppose a z-test gives \(z = 1.96\) and you run a two-tailed test. Then \(\Phi(1.96) \approx 0.9750\), so the p-value is
$$2 \times (1 - 0.9750) \approx 0.05$$— exactly the classic 5% threshold. Because p is not below 0.05, you would be right on the borderline of rejecting H₀.
FAQ
One-tailed or two-tailed? Use two-tailed unless your hypothesis specifies a direction (e.g. "greater than"). Two-tailed p-values are twice the one-tailed value for symmetric distributions.
What does "significant" mean? A p-value below your chosen α (commonly 0.05 or 0.01) means you reject the null hypothesis at that level.
Does a small p-value prove my hypothesis? No. It only quantifies evidence against H₀; it does not measure effect size or confirm the alternative directly.


