What Is a P-Value from a Z-Score?
A z-score measures how many standard deviations an observation lies from the mean of a standard normal distribution. The p-value translates that z-score into a probability: how likely you would be to observe a result this extreme if the null hypothesis were true. This calculator converts any z-score into its corresponding p-value for two-tailed, left-tailed, or right-tailed hypothesis tests.
How to Use This Calculator
Enter your z-score (it can be positive or negative) and choose the test type. A two-tailed test checks for a difference in either direction; left-tailed and right-tailed tests check for a difference in one specific direction. Click calculate to get the p-value plus the cumulative probability \(\Phi(z)\).
The Formula Explained
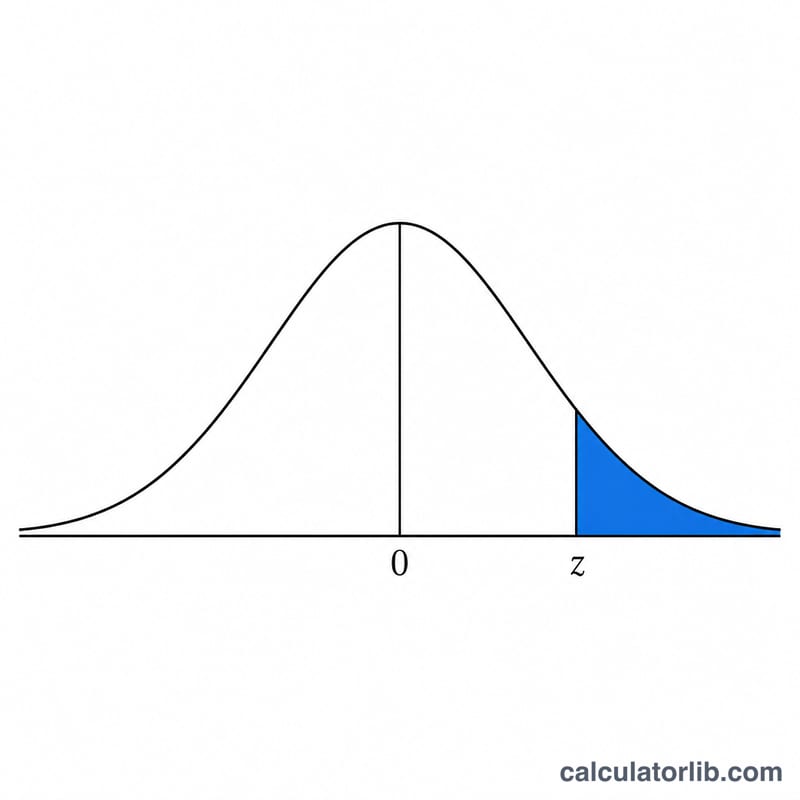
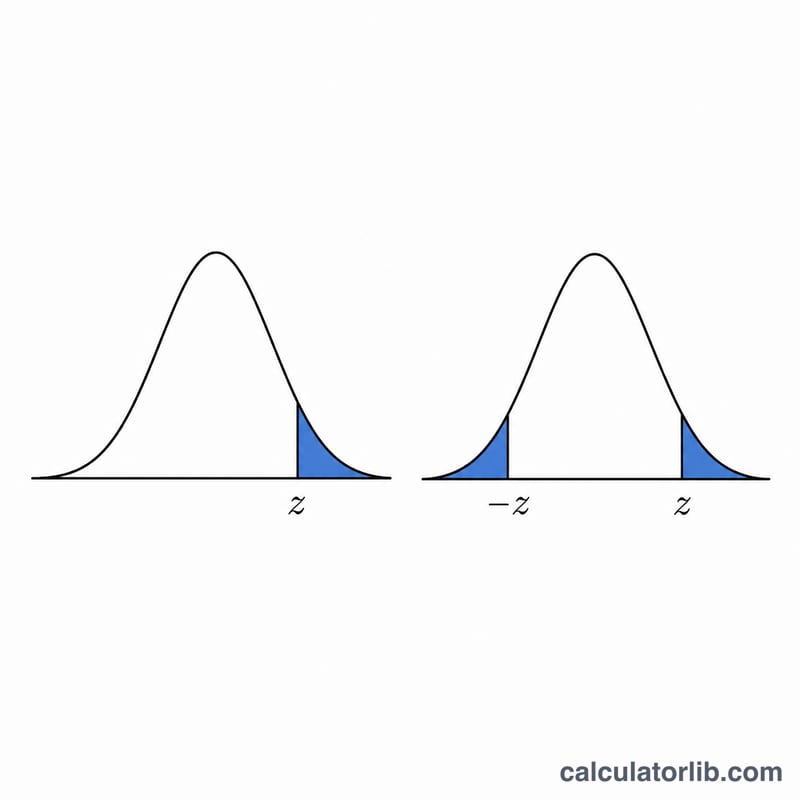
The core building block is the standard normal cumulative distribution function, \(\Phi(z)\), which gives the area under the bell curve to the left of \(z\). It is computed from the error function: $$\Phi(z) = \tfrac{1}{2}\left(1 + \operatorname{erf}\left(\frac{z}{\sqrt{2}}\right)\right)$$ For a two-tailed test we double the area in the upper tail: $$p = 2\left(1 - \Phi(|z|)\right)$$ For a right-tailed test \(p = 1 - \Phi(z)\), and for a left-tailed test \(p = \Phi(z)\). This tool evaluates erf with the Abramowitz & Stegun 7.1.26 approximation, accurate to about 7 decimal places.
Worked Example
Suppose \(z = 1.96\) and you run a two-tailed test. \(\Phi(1.96) \approx 0.9750\), so \(1 - \Phi(1.96) \approx 0.0250\), and $$p = 2 \times 0.0250 = 0.05$$ This is exactly the threshold for the classic 95% confidence level — a z of 1.96 corresponds to the familiar \(\alpha = 0.05\) cutoff.
FAQ
Should I use one- or two-tailed? Use two-tailed unless you have a specific directional hypothesis decided before collecting data.
What if my z-score is negative? For two-tailed tests the sign does not matter because we take the absolute value. For one-tailed tests the sign determines which tail you are testing.
How accurate is the result? The erf approximation gives roughly 7 correct decimal places, which is more than enough for any practical hypothesis test.


