What is the P-Value from t-Score Calculator?
This tool converts a Student's t statistic and its degrees of freedom (df) into a p-value, the probability of observing a result at least as extreme as your t-score if the null hypothesis were true. It supports both two-tailed and one-tailed tests, which is the most common step after computing a t-statistic in a t-test or regression coefficient analysis.
How to use it
Enter your t-score (it can be negative — only the magnitude matters for the p-value), the degrees of freedom, and choose whether your test is two-tailed or one-tailed. The calculator returns the p-value along with both the one-tailed and two-tailed values so you can compare against your chosen significance level (commonly \(\alpha = 0.05\)).
The formula
The upper-tail area of the t-distribution is found from the regularized incomplete beta function:
$$\text{upperTail} = \tfrac{1}{2}\, I_{x}\!\left(\tfrac{\text{df}}{2},\, \tfrac{1}{2}\right), \quad x = \frac{\text{df}}{\text{df} + \text{t}^{2}}$$
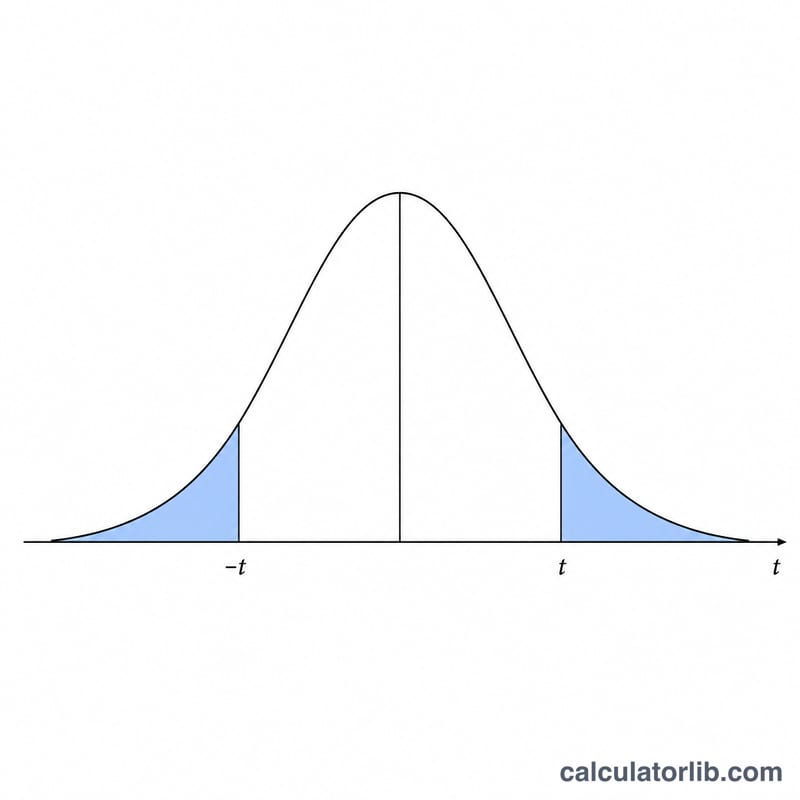
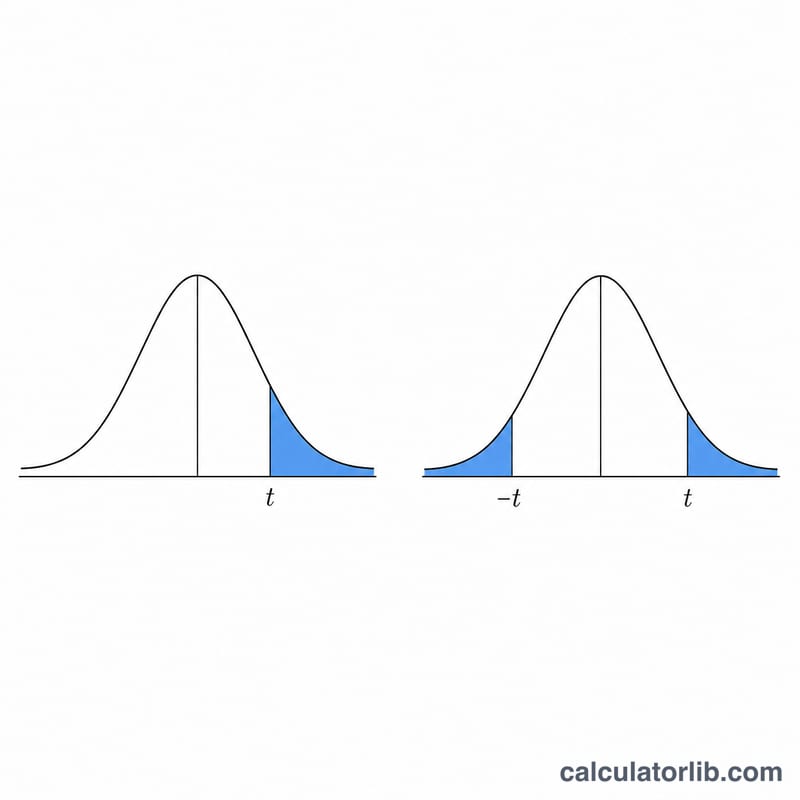
Then the two-tailed p-value is \(p = 2 \cdot \text{upperTail} = 2\cdot(1 - T_{\text{cdf}}(|t|, \text{df}))\), and the one-tailed p-value is simply \(\text{upperTail}\).
Worked example
For \(t = 2.228\) with \(\text{df} = 10\), the upper-tail area is \(0.0250\), so the two-tailed p-value is $$2 \times 0.0250 = 0.0500$$ This matches the classic critical value of t for a 5% two-tailed test at 10 degrees of freedom. For \(t = 2.0\), \(\text{df} = 10\), the upper tail is about \(0.0367\), giving a one-tailed p of \(0.0367\) and a two-tailed p of \(0.0734\).
FAQ
Does the sign of t matter? Not for the p-value — the calculator uses \(|t|\). The sign only tells you the direction of the effect.
When should I use one-tailed? Use one-tailed only when your hypothesis is directional (you predicted the sign in advance). Otherwise use two-tailed.
What is a significant p-value? A p-value below your chosen \(\alpha\) (often 0.05) is conventionally considered statistically significant, but always interpret it in context.


