What is a paired t-test?
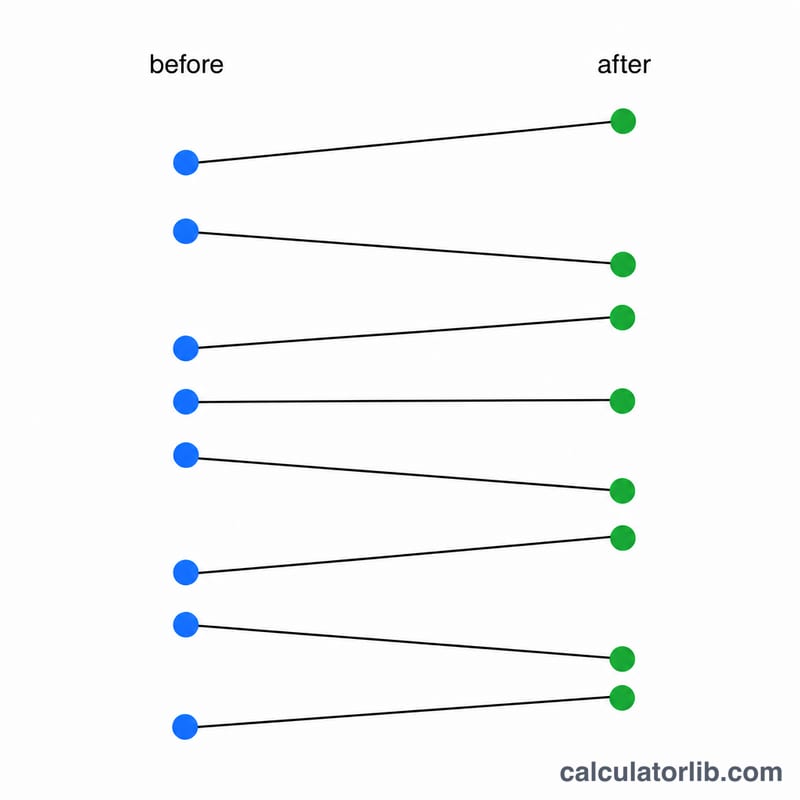
A paired-samples (dependent) t-test compares two related measurements taken from the same subjects — such as a before/after measurement on each person. Instead of comparing two independent groups, it analyses the differences within each pair, which removes between-subject variability and increases statistical power.
How to use this calculator
Enter your two sets of measurements as comma-separated lists. The first value of "Before" pairs with the first value of "After", and so on. The calculator computes each pair's difference, the mean difference, the standard deviation of the differences, the standard error, the t-statistic and the degrees of freedom.
The formula explained
For each pair compute \(d = \text{before} - \text{after}\). Then the mean difference is \(\bar{d} = \sum d / n\). The sample standard deviation uses \(n-1\) in the denominator:
$$s_d = \sqrt{\frac{\sum (d - \bar{d})^2}{n - 1}}$$The standard error is \(s_d / \sqrt{n}\), and the test statistic is
$$t = \frac{\bar{d}}{s_d / \sqrt{n}}$$with \(df = n - 1\).
Worked example
Before = 120, 125, 130, 128, 122 and After = 115, 118, 121, 119, 116. Differences are 5, 7, 9, 9, 6 with mean \(\bar{d} = 36/5 = 7.2\). The sum of squared deviations is 12.8, so
$$s_d = \sqrt{12.8/4} = \sqrt{3.2} \approx 1.7889$$The standard error is \(1.7889/\sqrt{5} \approx 0.8\), giving
$$t = \frac{7.2}{0.8} = 9.0$$with \(df = 4\).
FAQ
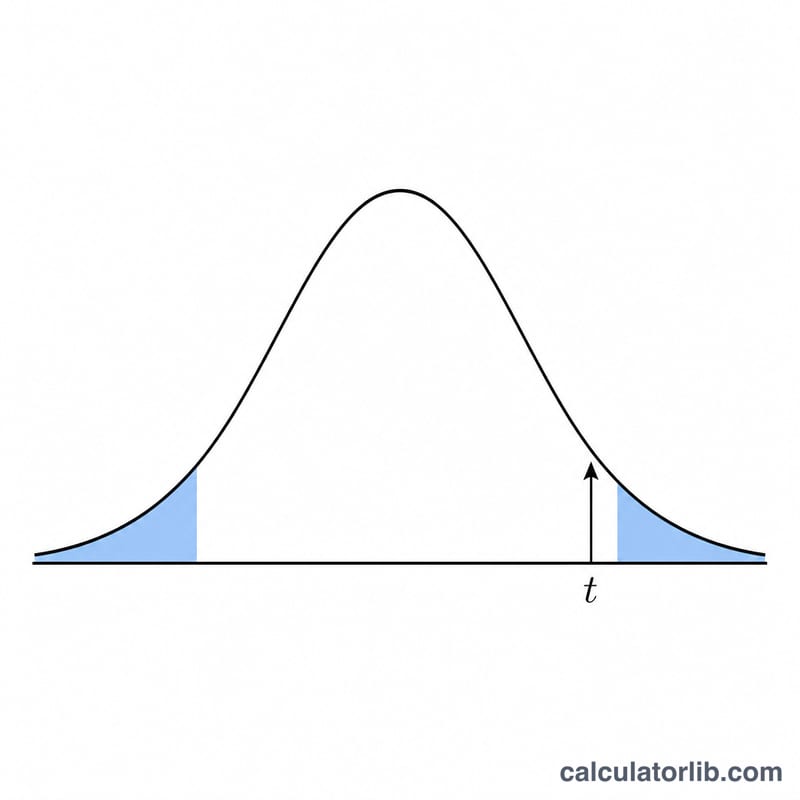
What does the t-statistic tell me? A larger absolute t means a larger, more reliable difference relative to its variability. Compare it to a critical t value (or use a p-value table) for your df and significance level.
Do the two lists need equal length? Yes — each value must have a partner. The calculator pairs them in order and uses the shorter length if they differ.
When should I use a paired test instead of an independent t-test? Use paired when the same units are measured twice (repeated measures, matched pairs); use independent when the two samples are unrelated groups.


