What Is the Range in Statistics?
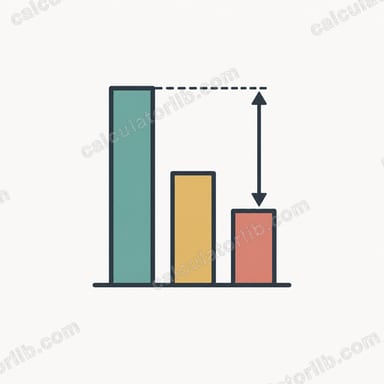
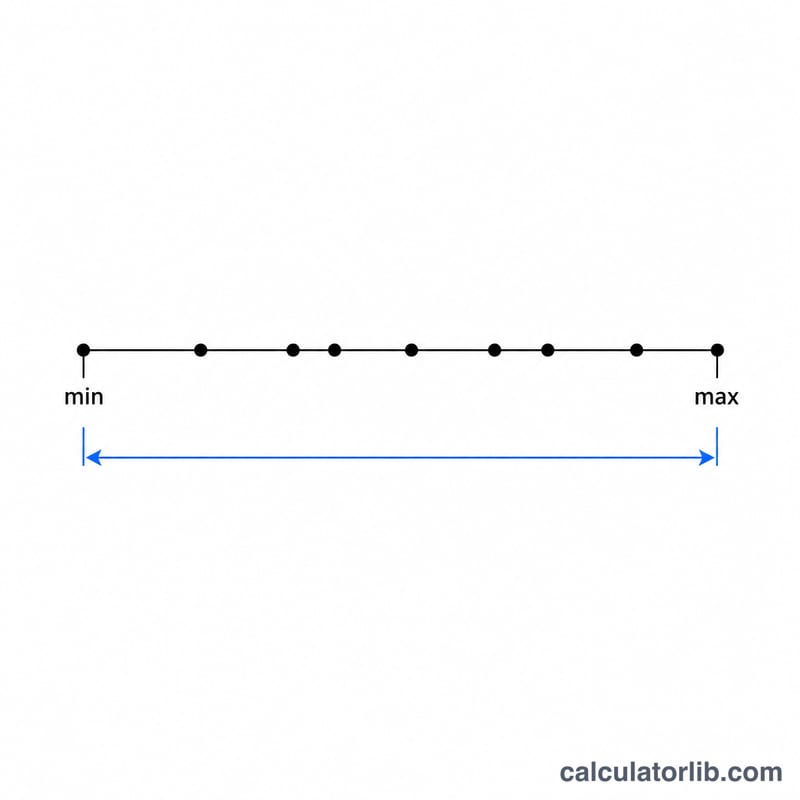
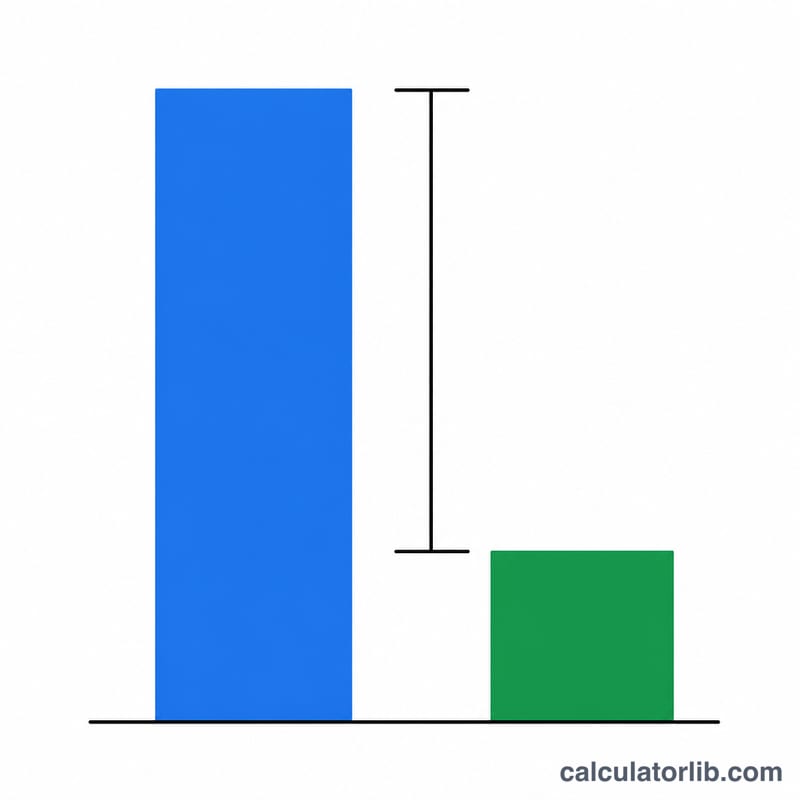
The range is the simplest measure of dispersion in a data set. It tells you how far apart the largest and smallest values are by subtracting the minimum from the maximum. A larger range means the values are more spread out; a smaller range means they cluster closely together.
How to Use This Calculator
Type your numbers into the box, separated by commas or spaces (for example, 4, 8, 15, 16, 23, 42). The calculator scans the list, finds the maximum and minimum values, subtracts them, and shows the range along with the count of values you entered. Both whole numbers and decimals are supported, including negatives.
The Formula Explained
The range is defined as:
$$\text{Range} = \max\!\left(\text{Numbers}\right) - \min\!\left(\text{Numbers}\right)$$
Because it depends only on the two extreme values, the range is quick to compute but sensitive to outliers. A single unusually high or low number can dramatically inflate it, which is why it is often reported alongside measures like the standard deviation or interquartile range.
Worked Example
Suppose your data set is 4, 8, 15, 16, 23, 42. The maximum is 42 and the minimum is 4. The range is therefore $$42 - 4 = 38$$ 38. Even though most values fall between 4 and 23, the value 42 pushes the range up to 38, illustrating the range's sensitivity to extremes.
FAQ
Can the range be negative? No. Since you always subtract the smallest value from the largest, the range is zero or positive. It equals zero only when every value is identical.
Does the range use all the data? No — only the two extreme values. That makes it easy to interpret but a poor summary of overall variability when outliers are present.
What units does the range have? The same units as your original data. If you measured in centimeters, the range is also in centimeters.


