What Is the Range?
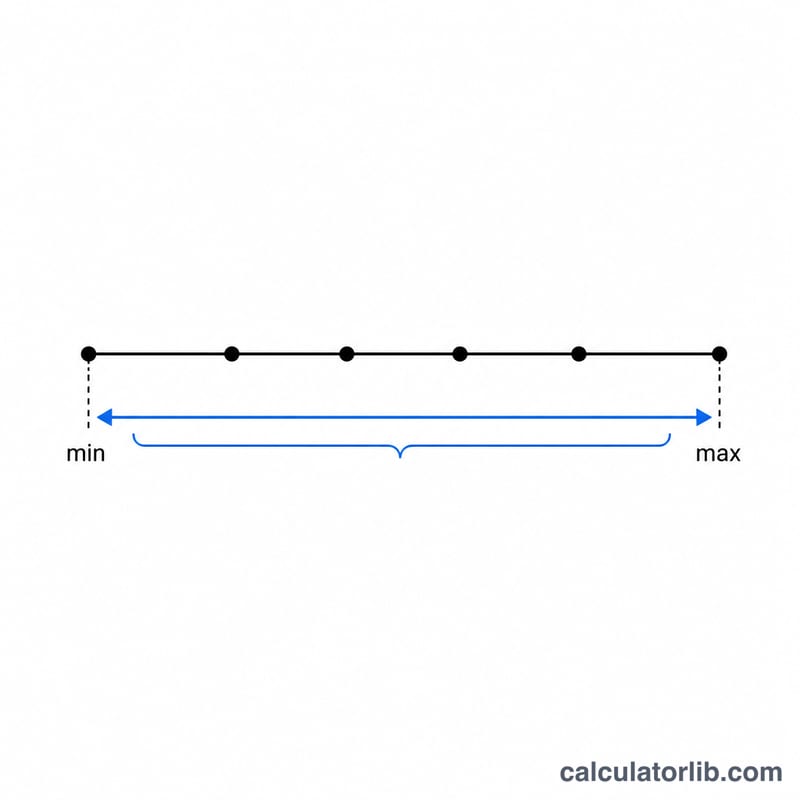
The range is one of the simplest measures of spread (dispersion) in statistics. It tells you how far apart the largest and smallest values in a data set are. A large range means the values are widely scattered; a small range means they are tightly clustered. Because it uses only two values, the range is quick to compute but sensitive to outliers.
How to Use This Calculator
Type your numbers into the box, separated by commas or spaces (for example 4, 8, 15, 16, 23, 42). The calculator finds the maximum and minimum, subtracts them, and reports the range along with the count of values. Decimals and negative numbers are supported.
The Formula Explained
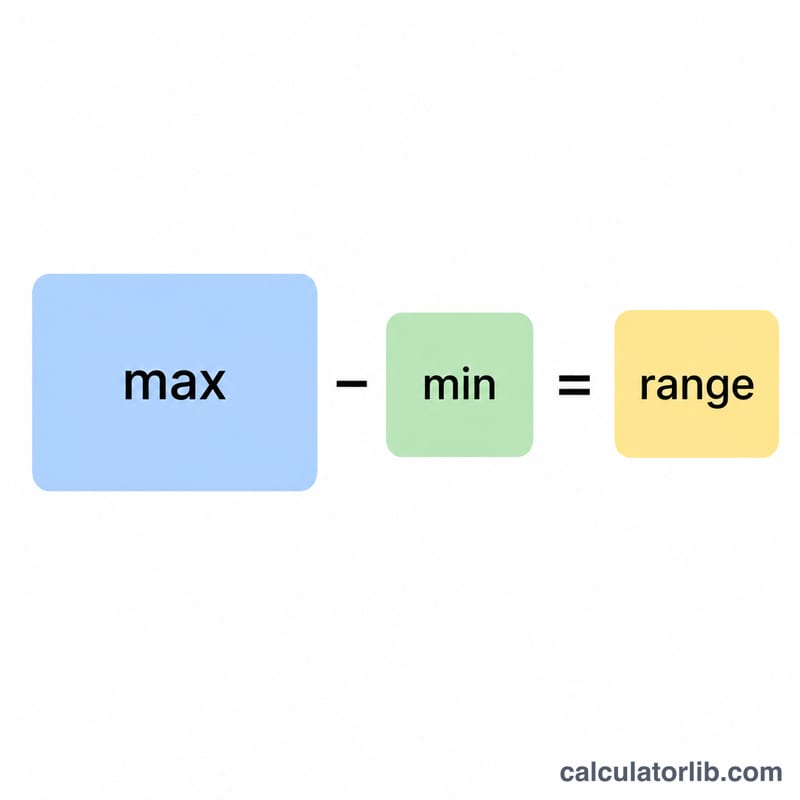
The range is defined as:
$$\text{Range} = \max\!\left(\text{Data Set}\right) - \min\!\left(\text{Data Set}\right)$$
First locate the largest value in your list, then the smallest, and subtract. The result is always zero or positive. If every value is identical, the range is 0.
Worked Example
Consider the data set 4, 8, 15, 16, 23, 42. The maximum is 42 and the minimum is 4. So the range is $$42 - 4 = \mathbf{38}.$$ This single number summarises the total spread of the values.
FAQ
Does the range change with outliers? Yes — because it depends only on the extreme values, a single unusually large or small value can dramatically change the range.
Can the range be negative? No. Since the maximum is always at least as large as the minimum, the range is never negative.
What is a better measure of spread? For data with outliers, the interquartile range (IQR) or standard deviation give a more robust picture of dispersion.


