What this calculator does
The Range, Mean and Sum Calculator turns a plain list of numbers into the six most common descriptive statistics: the minimum, maximum, range, mean (average), sum (total) and the count of data points. It is a pure, universal math tool — no units, no currency, no country-specific rules. Enter any real numbers, including decimals and negatives.
How to use it
Type one number per line into the data box. Blank lines and any text that is not a valid number are ignored automatically, so a stray empty row will not be counted as zero. The number of data points (\(n\)) is computed for you from the valid entries — you do not need to enter it. Press calculate to see all results at once.
The formulas explained
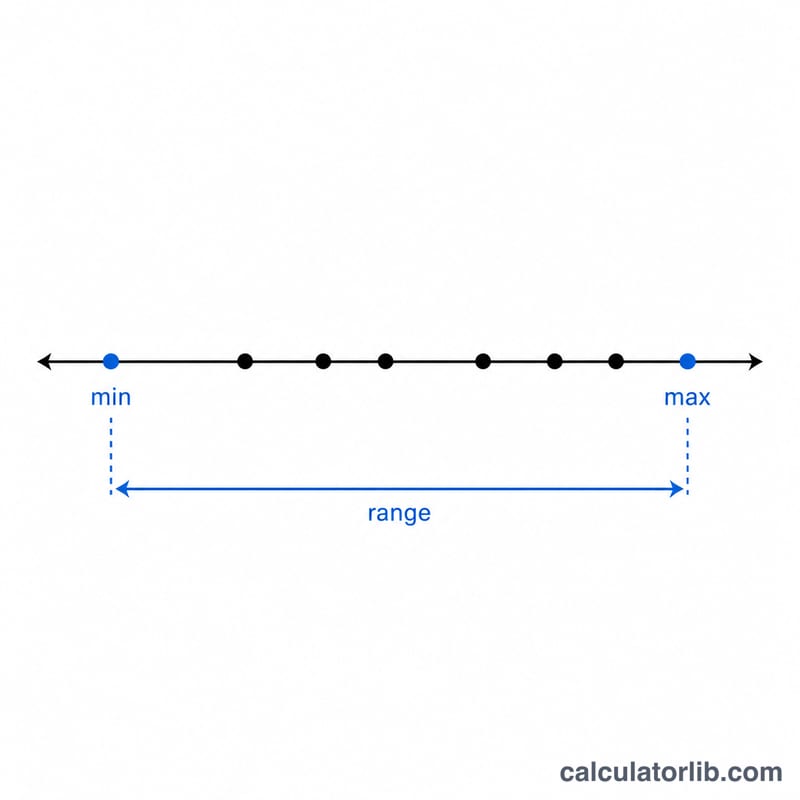
Let your valid values be \(x_1, x_2, ..., x_n\). The sum is the total of every value, \(\sum x_i\). The count \(n\) is how many values you entered. The mean (average) is the sum divided by the count. The minimum and maximum are the smallest and largest values, and the range is simply maximum minus minimum. Division by zero is guarded: with no valid numbers, the tool reports "no data" instead of an error.
$$\text{Sum} = \sum_{i=1}^{n} x_i, \quad \text{Mean} = \frac{\text{Sum}}{n}, \quad \text{Range} = \max(x) - \min(x)$$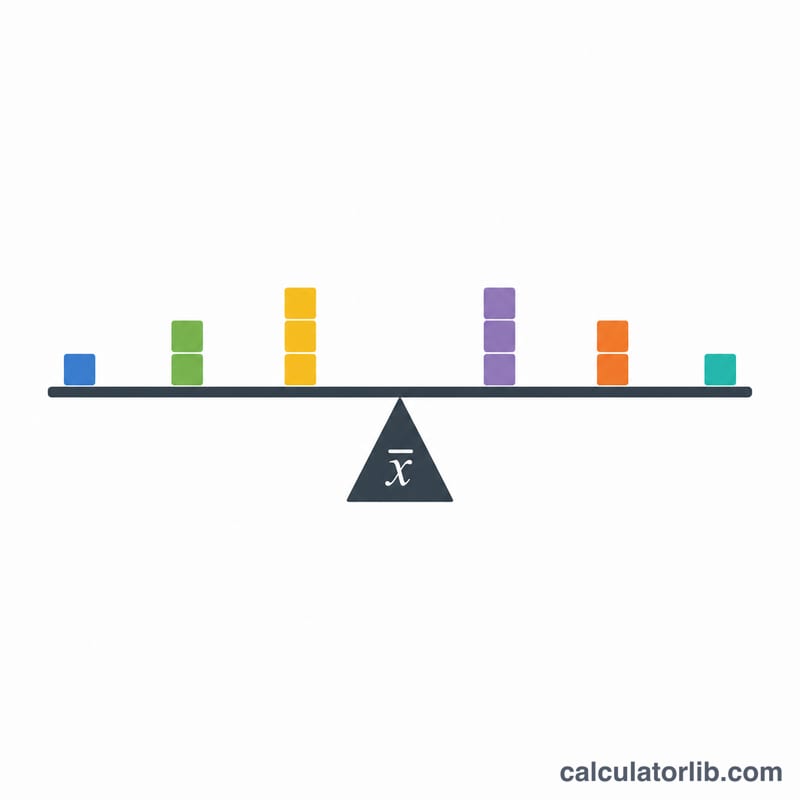
Worked example
Suppose your data is 10, 20, 30, 40, 50, so \(n = 5\). The sum is $$10 + 20 + 30 + 40 + 50 = 150.$$ The mean is $$150 / 5 = 30.$$ The minimum is 10, the maximum is 50, and the range is $$50 - 10 = 40.$$ With negatives, say -2, 4.5, 7, 0.5, the sum is 10, the mean is 2.5, the minimum is -2, the maximum is 7 and the range is 9.
FAQ
What is the difference between range and mean? The range measures spread (how far apart the extremes are), while the mean measures the central, typical value.
Are decimals and negatives allowed? Yes. Each line is parsed as a real number, so values like -3.5 or 0.25 are fully supported with high precision.
What happens with a single value? With one number, the range is 0, and the minimum, maximum, mean and sum all equal that value.


