
What Is the Range?
The range is one of the simplest measures of spread in statistics. It tells you how far apart the extreme values in a data set are by subtracting the smallest value from the largest value. A large range means your data is widely dispersed; a small range means the values cluster tightly together.
How to Use This Calculator
Type your numbers into the box, separated by commas or spaces (for example 4, 8, 15, 16, 23, 42). The calculator scans every value, identifies the maximum and minimum, and reports the range along with the count of values entered. Decimals and negative numbers are fully supported.
The Formula Explained
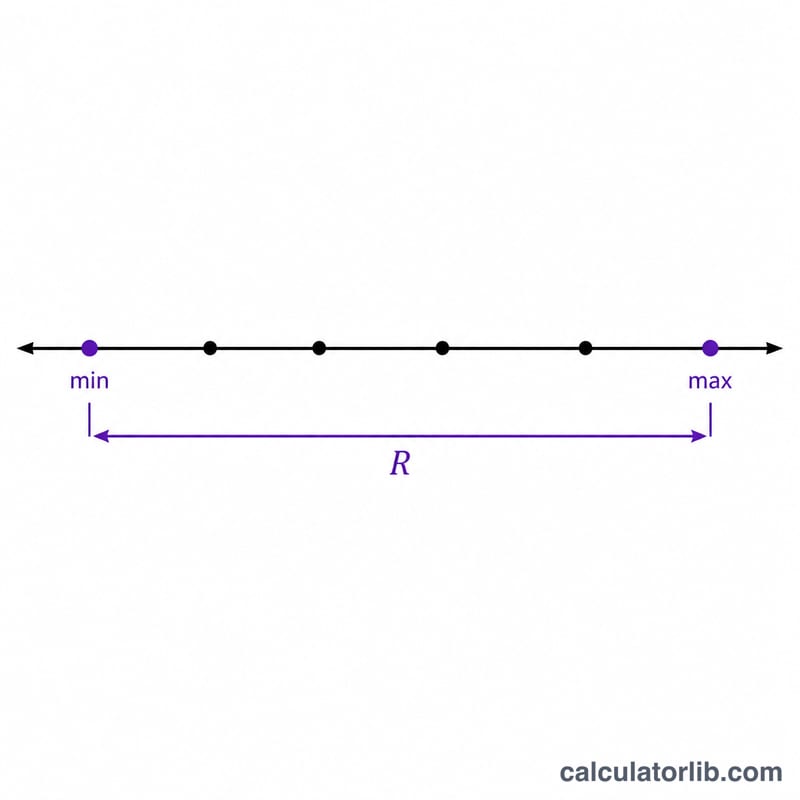
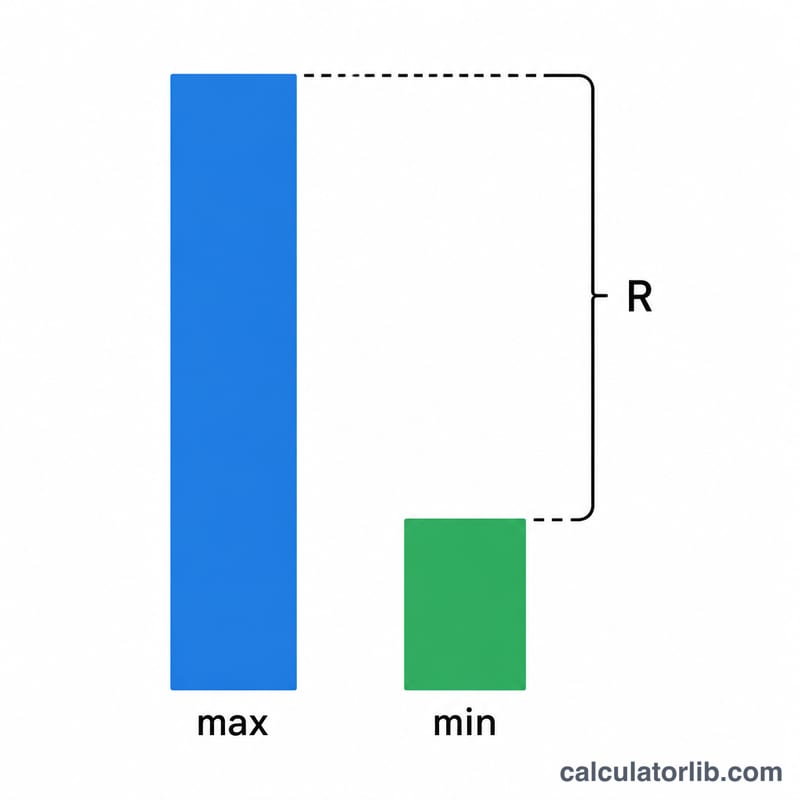
The range is defined as:
$$\text{Range} = \max\!\left(x\right) - \min\!\left(x\right)$$
where \(\max(x)\) is the largest value in your list and \(\min(x)\) is the smallest. There is no averaging or summing involved — only the two extreme observations matter.
Worked Example
Consider the data set 4, 8, 15, 16, 23, 42. The maximum value is 42 and the minimum value is 4. Therefore the range is $$42 - 4 = 38$$ Even though there are six numbers, only the two extremes determine the result.
FAQ
Does the range work with negative numbers? Yes. For example the set −5, 3, 10 has a range of \(10 - (-5) = 15\).
Why is the range sensitive to outliers? Because it depends only on the highest and lowest values, a single extreme point can dramatically inflate the range. For a more robust measure, consider the interquartile range or standard deviation.
What if I enter only one number? The range is 0, since the maximum and minimum are the same value.


