
What is the Process Capability Index?
The process capability index measures how well a manufacturing or business process can produce output within its specification limits. Cp describes the potential capability — how the spread of the process compares to the allowed tolerance — while Cpk describes the actual capability, accounting for whether the process is centered between the limits. These indices are core tools in Six Sigma and statistical process control (SPC).
How to use this calculator
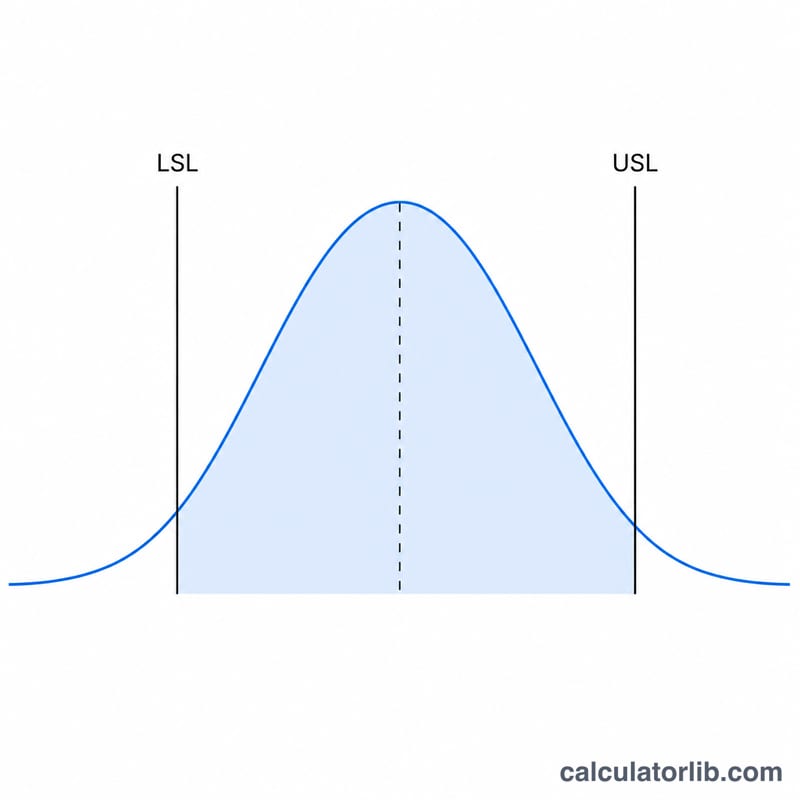
Enter the Upper Specification Limit (USL), Lower Specification Limit (LSL), the measured process mean (\(\mu\)), and the process standard deviation (\(\sigma\)). The calculator returns Cp, Cpk, and the one-sided indices CPU and CPL. A higher value means a more capable process; values of 1.33 or above are commonly required, and 1.67+ is typical for critical characteristics.
The formula explained
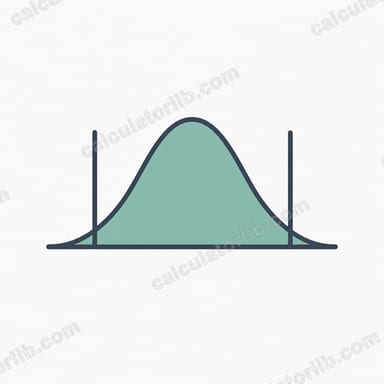
Cp = (USL − LSL) / (6σ). The denominator 6σ represents the natural process spread (±3σ around the mean covers about 99.73% of output). Cpk takes the smaller of two one-sided ratios — CPU = (USL − μ)/(3σ) and CPL = (μ − LSL)/(3σ) — so an off-center process is penalized. When the process is perfectly centered, Cp equals Cpk.
$$\begin{gathered} C_p = \frac{\text{USL} - \text{LSL}}{6\,\sigma} \qquad C_{pk} = \min\!\left(C_{pu},\, C_{pl}\right) \\[1.5em] \text{where}\quad \left\{ \begin{aligned} C_{pu} &= \frac{\text{USL} - \mu}{3\,\sigma} \\[0.4em] C_{pl} &= \frac{\mu - \text{LSL}}{3\,\sigma} \end{aligned} \right. \end{gathered}$$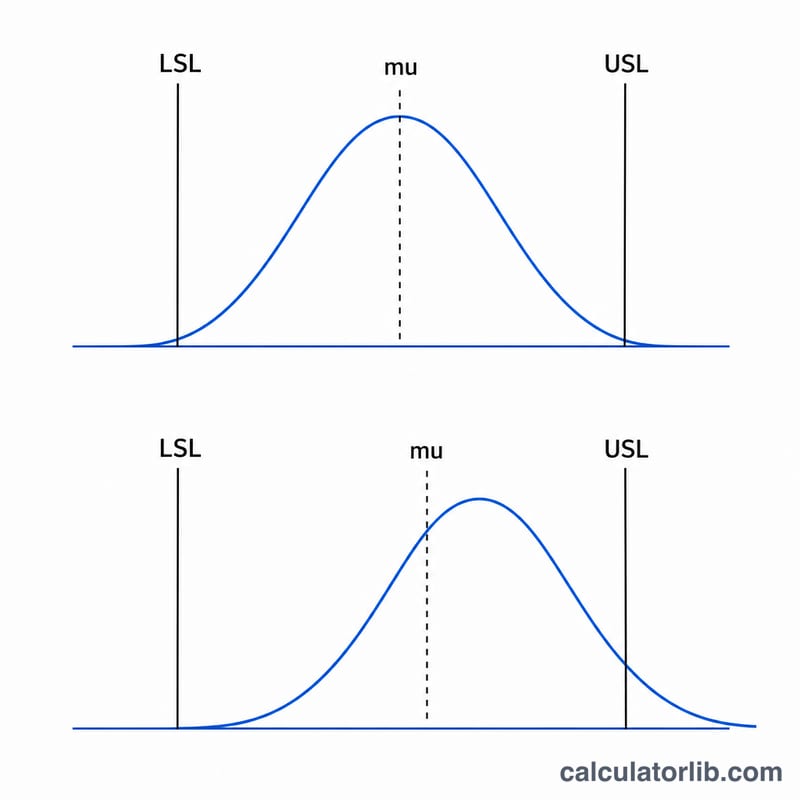
Worked example
Suppose USL = 10, LSL = 2, \(\mu = 6\), \(\sigma = 1\). Then $$C_p = \frac{10 - 2}{6 \times 1} = \frac{8}{6} = 1.333.$$ \(C_{pu} = \frac{10 - 6}{3} = 1.333\) and \(C_{pl} = \frac{6 - 2}{3} = 1.333\), so \(C_{pk} = \min(1.333,\, 1.333) = 1.333\). Because the process is centered, Cp and Cpk match.
FAQ
What is a good Cpk value? Generally Cpk ≥ 1.33 is considered capable, and ≥ 1.67 is preferred for safety-critical features.
Why is Cpk lower than Cp? Cpk drops below Cp whenever the process mean drifts away from the center of the spec range. The further off-center, the larger the gap.
Can Cpk be negative? Yes — if the mean falls outside a specification limit, the corresponding one-sided index becomes negative, indicating the process produces out-of-spec parts on average.