What is skewness?
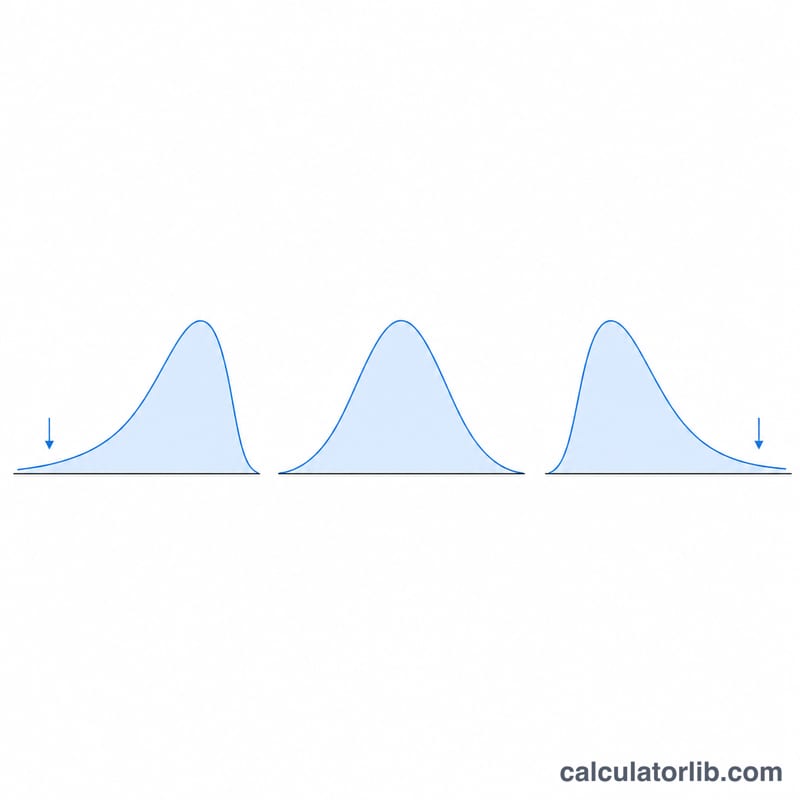
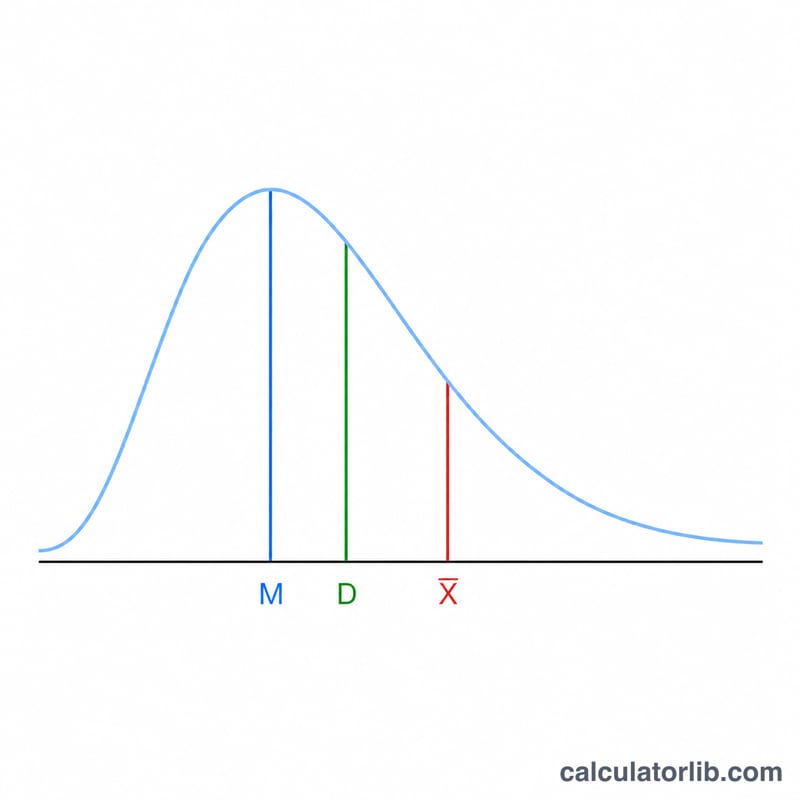
Skewness measures the asymmetry of a probability distribution or data set around its mean. A skewness of zero indicates a symmetric distribution. Positive skewness means a longer tail on the right (large values pull the mean up); negative skewness means a longer tail on the left. This calculator reports either the population skewness or the bias-corrected sample skewness, along with the mean and standard deviation.
How to use it
Enter your numbers separated by commas or spaces, then pick a method. Use Population when your data represents the entire group of interest, and Sample (the adjusted Fisher-Pearson estimator used by Excel's SKEW and many stats packages) when you have a sample drawn from a larger population.
The formula explained
The population skewness is the average cubed standardized deviation: $$g_1 = \frac{1}{n} \sum_{i=1}^{n} \left( \frac{x_i - \bar{x}}{\sigma} \right)^{3}$$ where \(\sigma\) uses division by \(n\). The sample version applies a correction factor: $$G_1 = \frac{n}{(n-1)(n-2)} \sum_{i=1}^{n} \left( \frac{x_i - \bar{x}}{s} \right)^{3}$$ where \(s\) uses division by \(n-1\). The correction removes the downward bias present in small samples.
Worked example
For the data 2, 4, 6, 8, 20: the mean is 8. $$\sum (x_i-\bar{x})^3 = (-6)^3+(-4)^3+(-2)^3+(0)^3+(12)^3 = -216-64-8+0+1728 = 1440$$ Population \(\sigma = \sqrt{160/5} = 6.3246\), so $$g_1 = \frac{1440/5}{6.3246^3} = \frac{288}{252.98} \approx 1.1384$$ For the sample method, \(s = \sqrt{160/4} = 7.0711\), and $$G_1 = \frac{5}{4\cdot 3}\cdot\frac{1440}{353.55} = 0.4167\cdot 4.0729 \approx 1.6971$$
FAQ
Why do the two methods give different numbers? They use different standard deviations and the sample method adds a bias-correction factor, so the magnitudes differ for small data sets.
What does a value near 0 mean? The distribution is roughly symmetric. Values beyond \(\pm 1\) are generally considered highly skewed.
Which should I report? Use the sample estimator when generalizing from a sample; use population skewness when you have the complete data set.


