
What Is P-Hat?
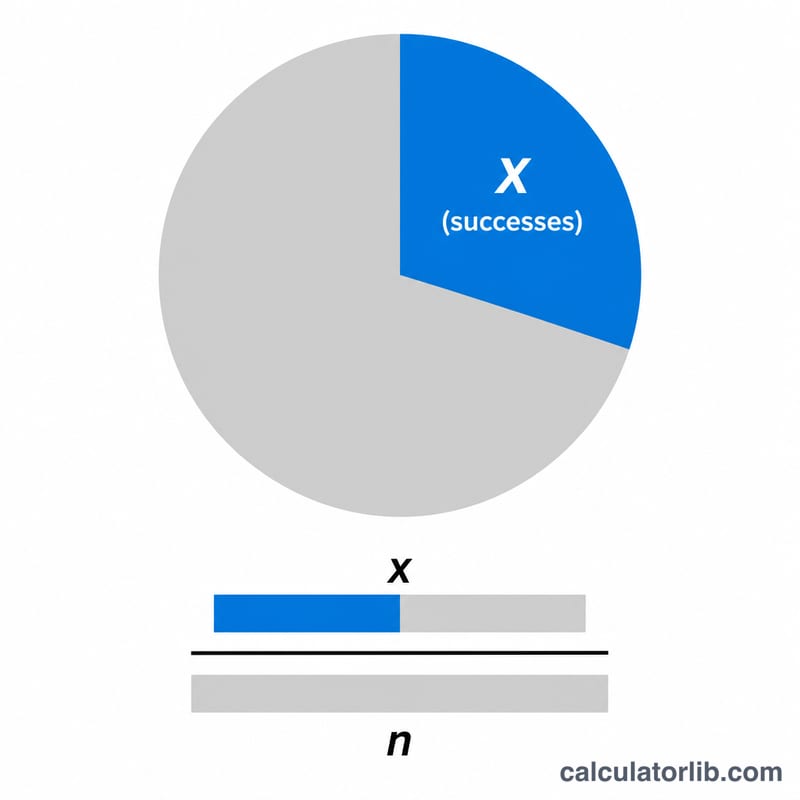
P-hat (written \(\hat{p}\)) is the sample proportion — the fraction of a sample that has a particular characteristic or "success." It is the point estimate of the unknown population proportion p. You compute it by dividing the number of successes (x) by the total sample size (n). This calculator works for any field: polling, quality control, biology, medicine, or classroom statistics.
How to Use This Calculator
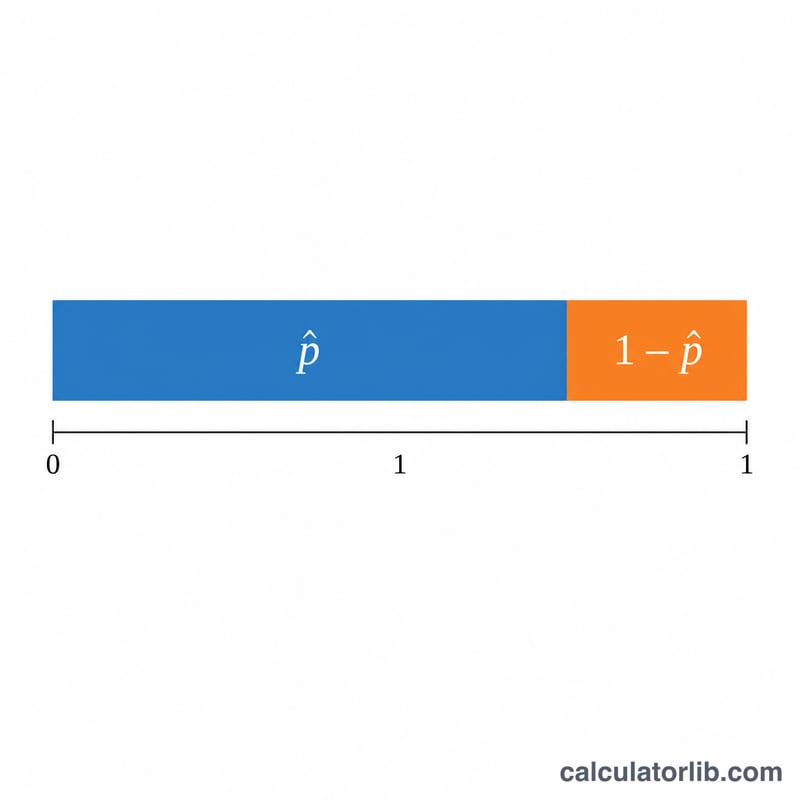
Enter two values: the number of successes x (how many items in your sample meet the condition) and the sample size n (the total number observed). The calculator returns \(\hat{p}\) as a decimal, the same value expressed as a percentage, and the complement \(\hat{q} = 1 - \hat{p}\) (the proportion of failures).
The Formula Explained
The formula is simply $$\hat{p} = \frac{\text{Successes }(x)}{\text{Sample Size }(n)}$$ Because x can never exceed n, \(\hat{p}\) always falls between 0 and 1. Multiply by 100 to read it as a percentage. The complement \(\hat{q} = 1 - \hat{p}\) is useful in confidence interval and standard error formulas, where the standard error of \(\hat{p}\) is \(\sqrt{\hat{p}\cdot\hat{q} / n}\).
Worked Example
Suppose a survey of n = 100 people finds that x = 40 support a proposal. Then $$\hat{p} = \frac{40}{100} = 0.40$$ or 40%. The complement \(\hat{q} = 1 - 0.40 = 0.60\), meaning 60% do not support it.
FAQ
What is the difference between p and \(\hat{p}\)? p is the true (often unknown) population proportion; \(\hat{p}\) is the estimate calculated from a sample.
Can \(\hat{p}\) be greater than 1? No. Since successes cannot exceed the sample size, \(\hat{p}\) is always between 0 and 1.
Why does \(\hat{q}\) matter? \(\hat{q} = 1 - \hat{p}\) appears in the standard error and confidence interval formulas for proportions, so it is commonly reported alongside \(\hat{p}\).


