What is post-test probability?
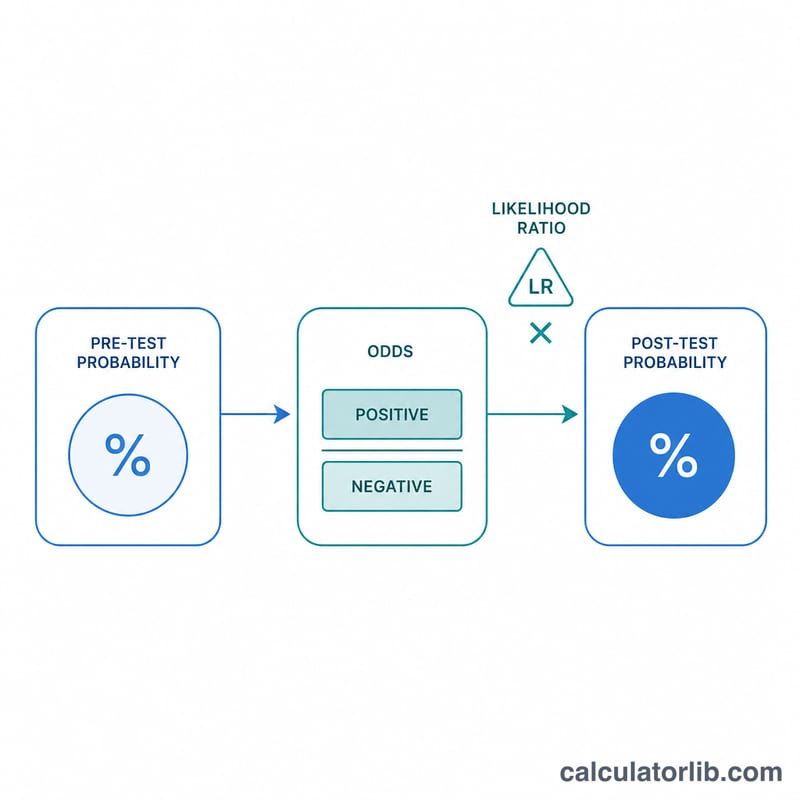
Post-test probability is the updated chance that a patient has a condition after a diagnostic test result is known. It is the heart of evidence-based diagnosis: a test does not simply say "yes" or "no" — it shifts your prior estimate up or down. This calculator applies Bayes' theorem in its convenient odds form, using a likelihood ratio (LR) to update the pre-test probability.
How to use it
Enter the pre-test probability (your estimate of disease before the test, as a percentage) and the likelihood ratio of the test result. Use the positive likelihood ratio (LR+) for a positive result and the negative likelihood ratio (LR−) for a negative result. The tool returns the post-test probability, plus the intermediate pre- and post-test odds.
The formula explained
Because probability and odds describe the same thing, we first convert probability to odds: \(\text{PreOdds} = P / (1 - P)\). Multiplying by the likelihood ratio gives \(\text{PostOdds} = \text{PreOdds} \times \text{LR}\). Finally we convert back to a probability:
$$\text{PostProb} = \frac{\text{PostOdds}}{1 + \text{PostOdds}}$$An LR above 1 raises the probability of disease; an LR below 1 lowers it; an LR of exactly 1 leaves it unchanged.
Worked example
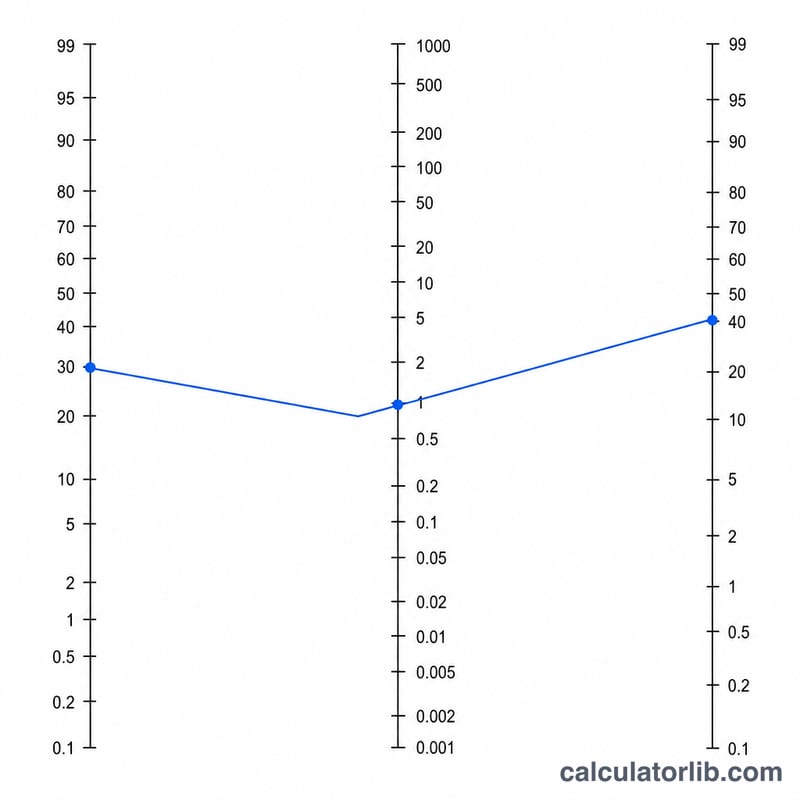
Suppose the pre-test probability is 30% and the test result has an LR of 10. Pre-test odds = \(0.30 / 0.70 = 0.4286\). Post-test odds = \(0.4286 \times 10 = 4.2857\). Post-test probability = \(4.2857 / (1 + 4.2857) = 0.8108\), or about 81%. The positive result has raised the suspicion of disease from 30% to 81%.
FAQ
Where do likelihood ratios come from? They are derived from a test's sensitivity and specificity: \(\text{LR+} = \text{sensitivity} / (1 - \text{specificity})\), \(\text{LR−} = (1 - \text{sensitivity}) / \text{specificity}\).
What is a "good" LR? As a rule of thumb, an LR+ above 10 or an LR− below 0.1 produces large, often conclusive changes in probability; values near 1 are clinically unhelpful.
Can pre-test probability be 100%? At 0% or 100% the odds become 0 or infinite, and no test can change a certainty — that is why estimates near, but not at, the extremes are used in practice.