
What is Spearman's Rank Correlation?
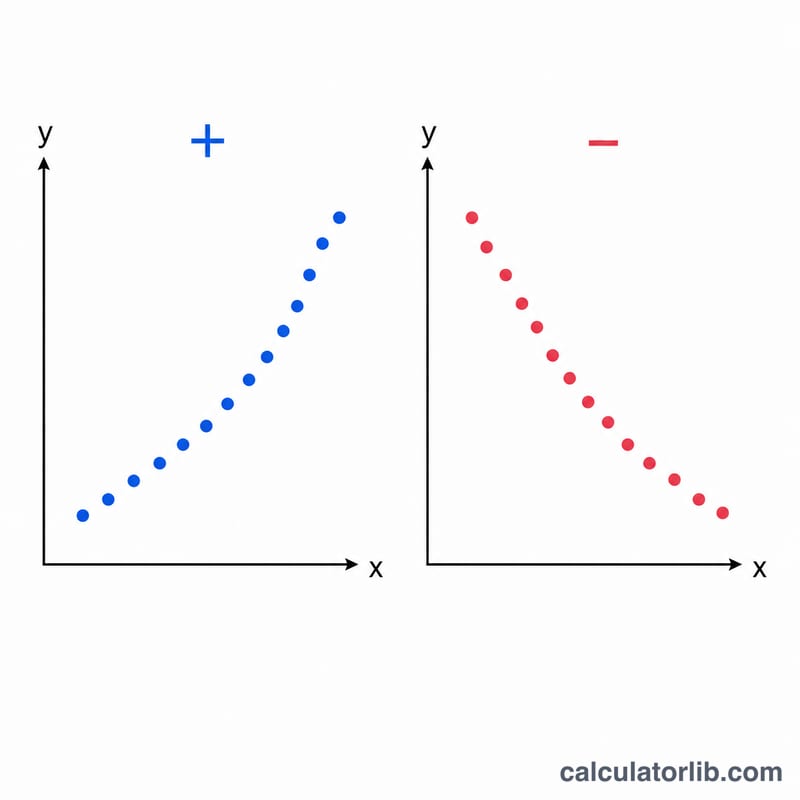
Spearman's rank correlation coefficient (\(\rho\), "rho") measures the strength and direction of a monotonic relationship between two variables. Unlike Pearson's correlation, it works on the ranks of the data rather than the raw values, making it robust to outliers and suitable for ordinal data or non-linear-but-monotonic trends. Values range from −1 (perfect negative monotonic relationship) through 0 (no monotonic relationship) to +1 (perfect positive monotonic relationship).
How to use this calculator
Enter your X values and Y values as comma- or space-separated lists. Each X must correspond to a Y at the same position, so both lists should contain the same number of entries. The calculator ranks each variable (assigning average ranks to ties), computes the squared rank differences, and returns \(\rho\) along with \(\sum d^{2}\) and the number of pairs \(n\).
The formula explained
The classic formula is $$\rho = 1 - \frac{6 \sum d_i^{2}}{n\left(n^{2}-1\right)}$$ where \(d\) is the difference between the rank of an X value and the rank of its paired Y value, and \(n\) is the number of pairs. This shortcut is exact only when there are no ties; this tool uses average ranks for ties, which gives a close approximation consistent with the standard convention.
Worked example
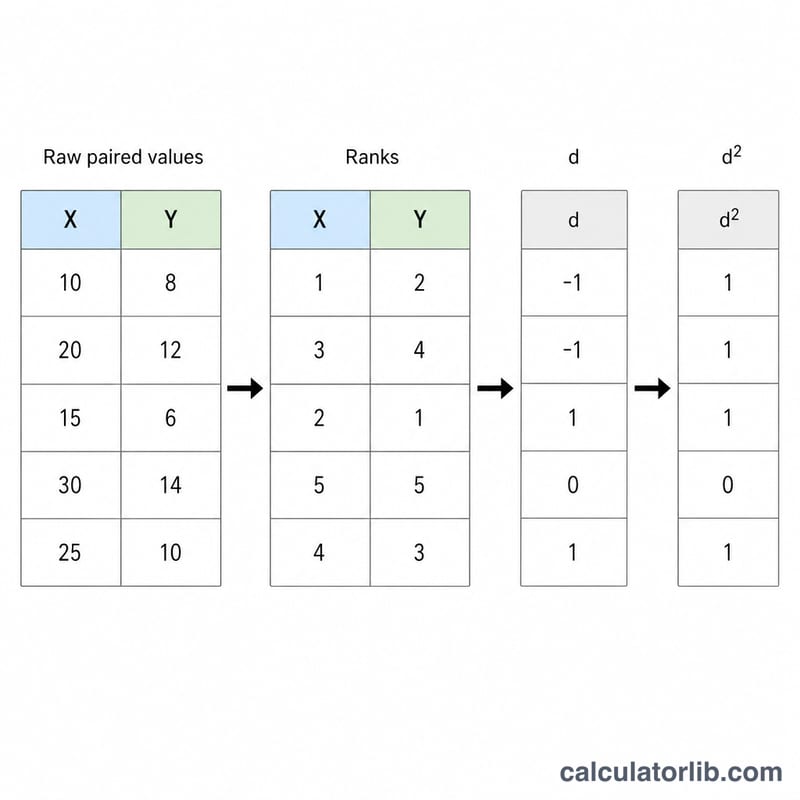
Take X = (1, 2, 3, 4, 5) and Y = (2, 1, 4, 3, 5). Ranking gives X ranks (1,2,3,4,5) and Y ranks (2,1,4,3,5). The differences \(d\) are (−1, 1, −1, 1, 0), so \(d^{2}\) = (1, 1, 1, 1, 0) and \(\sum d^{2} = 4\). With \(n = 5\): $$\rho = 1 - \frac{6(4)}{5(25 - 1)} = 1 - \frac{24}{120} = 1 - 0.2 = \mathbf{0.8}$$
FAQ
How is it different from Pearson's r? Pearson measures linear correlation on raw values; Spearman measures monotonic correlation on ranks, so it captures any consistently increasing or decreasing relationship.
What if my data has ties? This calculator assigns each tied value the average of the ranks it spans, the standard tie-handling method.
What counts as a strong correlation? As a rough guide, \(|\rho|\) above 0.7 is strong, 0.4–0.7 moderate, and below 0.4 weak — but always interpret in context.