
What Are Upper and Lower Fences?
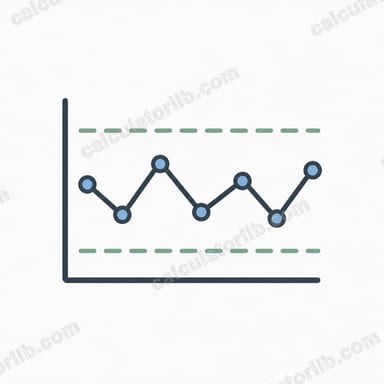
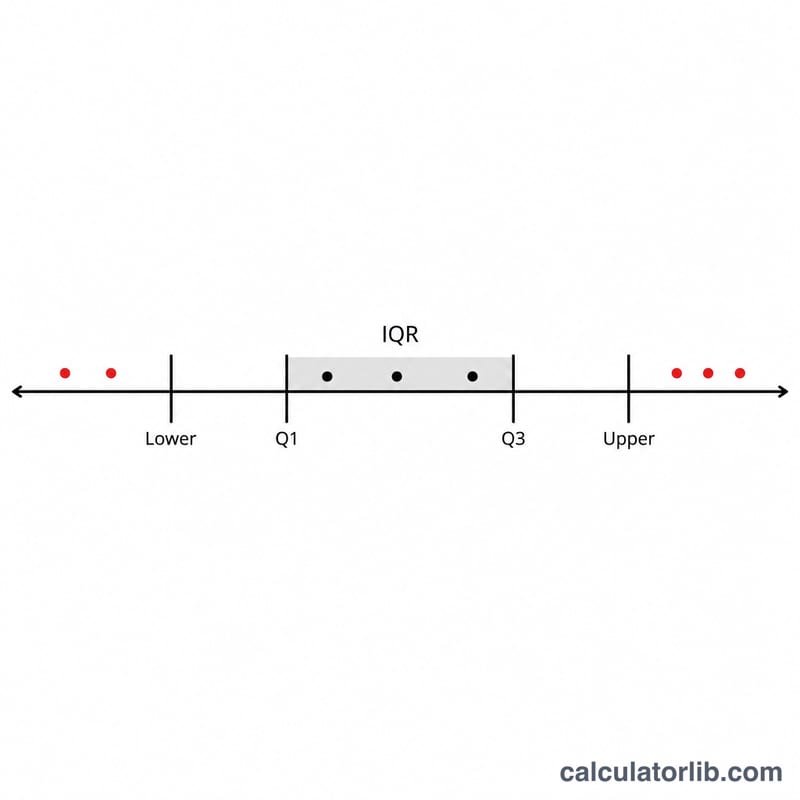
In descriptive statistics, the upper and lower fences are threshold values used to identify potential outliers in a data set. Any value below the lower fence or above the upper fence is flagged as an outlier. The fences are built from the quartiles of the data and the interquartile range (IQR), making them resistant to extreme values.
How to Use This Calculator
Enter the first quartile (Q1) and third quartile (Q3) of your data set. The multiplier k defaults to 1.5, the standard Tukey value used for "outliers." Use 3.0 if you want to flag only "extreme" outliers. The calculator returns the lower fence, the upper fence, and the IQR.
The Formula Explained
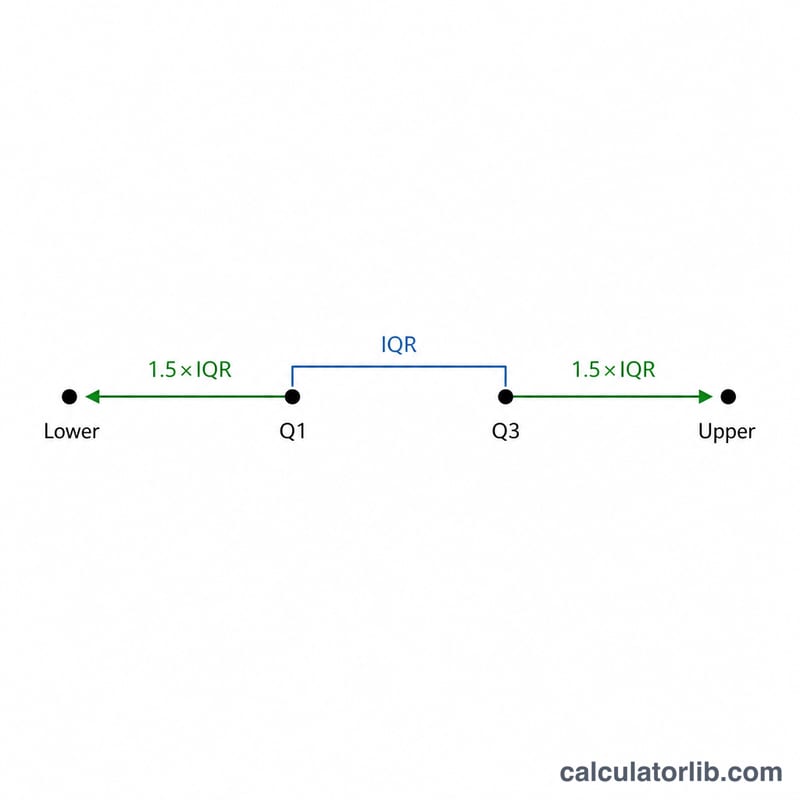
First compute the interquartile range: \(\text{IQR} = \text{Q3} - \text{Q1}\). Then the fences are:
$$\text{Lower} = \text{Q1} - \text{k}\cdot \text{IQR} \qquad \text{Upper} = \text{Q3} + \text{k}\cdot \text{IQR}$$ With the classic \(k = 1.5\), this captures the typical spread of the middle 50% of the data extended outward by one and a half IQRs.
Worked Example
Suppose \(\text{Q1} = 25\) and \(\text{Q3} = 75\). Then $$\text{IQR} = 75 - 25 = 50.$$ With \(k = 1.5\): $$\text{Lower} = 25 - 1.5 \times 50 = 25 - 75 = -50;$$ $$\text{Upper} = 75 + 1.5 \times 50 = 75 + 75 = 150.$$ Any data point below \(-50\) or above \(150\) would be considered an outlier.
FAQ
Why 1.5? The 1.5\(\times\)IQR rule was proposed by John Tukey as a practical balance — it flags genuine outliers without being overly aggressive for normally distributed data.
What does k = 3 mean? Using a multiplier of 3 marks only "far out" or extreme outliers, useful when you expect a lot of natural variation.
Can fences be negative? Yes. A negative lower fence simply means no realistic small value would be flagged on the low side, which is common with positive-only data.