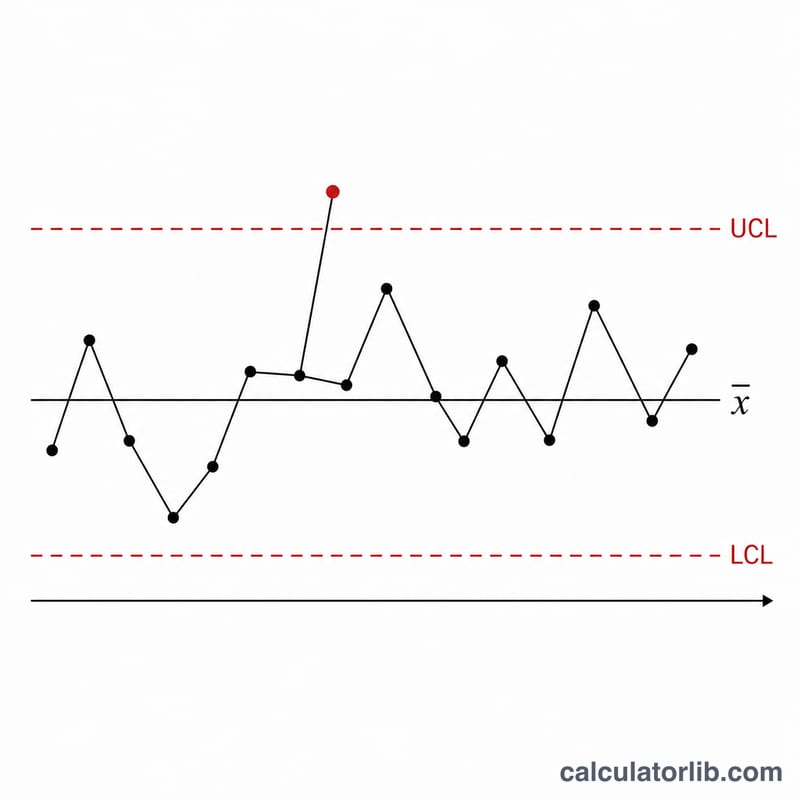
What Is the Upper Control Limit?
The Upper Control Limit (UCL) is the highest value a process measurement can take while still being considered "in control" on a statistical process control (SPC) chart. Together with the Lower Control Limit (LCL) and the center line (the process mean), it defines the boundaries within which a stable, predictable process should operate. Points that fall outside these limits signal special-cause variation that warrants investigation.
How to Use This Calculator
Enter three values: the process mean (\(\bar{x}\), the average of your samples), the standard deviation (\(\sigma\), the spread of your data), and the sigma multiplier (\(k\)). The classic Shewhart chart uses \(k = 3\), which captures roughly 99.7% of normally distributed data. The calculator returns the UCL, LCL, and the center line instantly.
The Formula Explained
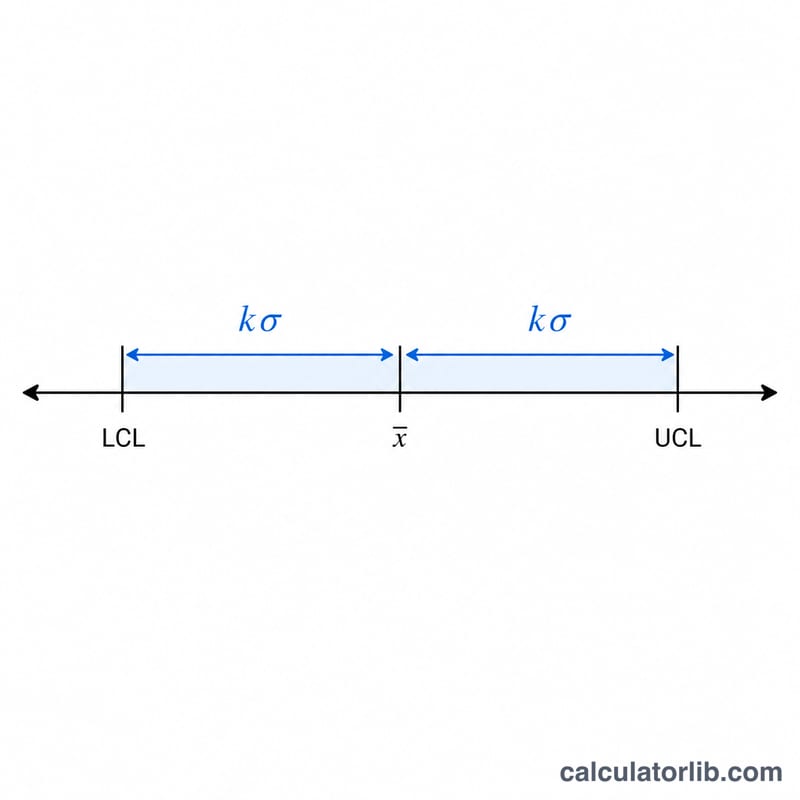
The control limits are computed as:
$$\text{UCL} = \bar{x} + k \cdot \sigma$$$$\text{LCL} = \bar{x} - k \cdot \sigma$$With \(k = 3\), the limits sit three standard deviations from the mean. A smaller \(k\) (such as 2) tightens the limits and triggers more alarms; a larger \(k\) loosens them. Some practitioners use \(\sigma\) as the standard deviation of subgroup averages rather than individual values, so be sure your \(\sigma\) matches your chart type.
Worked Example
Suppose a filling line has a mean fill of 50 mL and a standard deviation of 5 mL, with \(k = 3\). Then $$\text{UCL} = 50 + 3 \times 5 = 65 \text{ mL}$$ and $$\text{LCL} = 50 - 3 \times 5 = 35 \text{ mL}.$$ Any bottle measuring above 65 mL or below 35 mL is out of control and should be flagged.
FAQ
Why is k usually 3? Three-sigma limits balance sensitivity and false alarms — about 99.73% of in-control points fall inside, so out-of-limit points are rare unless something genuinely changed.
Can the LCL be negative? Mathematically yes. For counts or measurements that cannot be negative, the LCL is typically truncated to zero.
What chart does this apply to? The same \(\text{mean} \pm k \cdot \sigma\) logic underlies \(\bar{X}\), individuals (I-MR), and many other Shewhart control charts; only how you estimate \(\sigma\) differs.


