
What is the Central Limit Theorem?
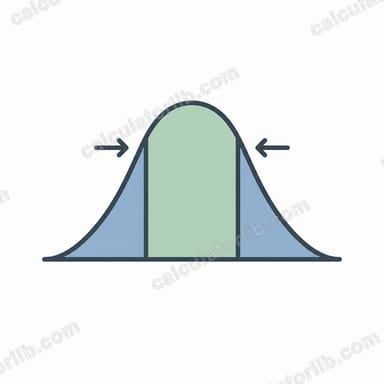
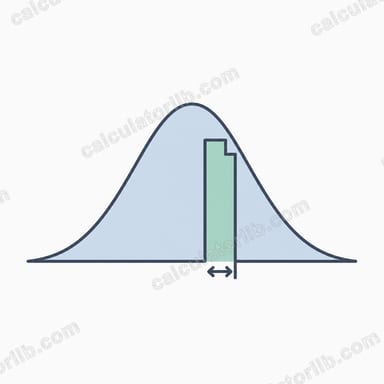
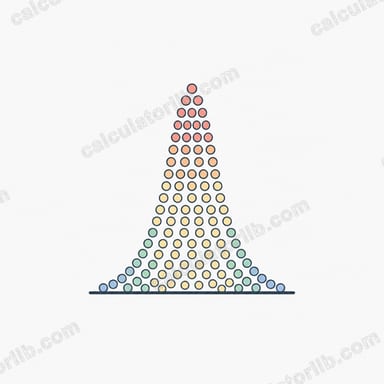
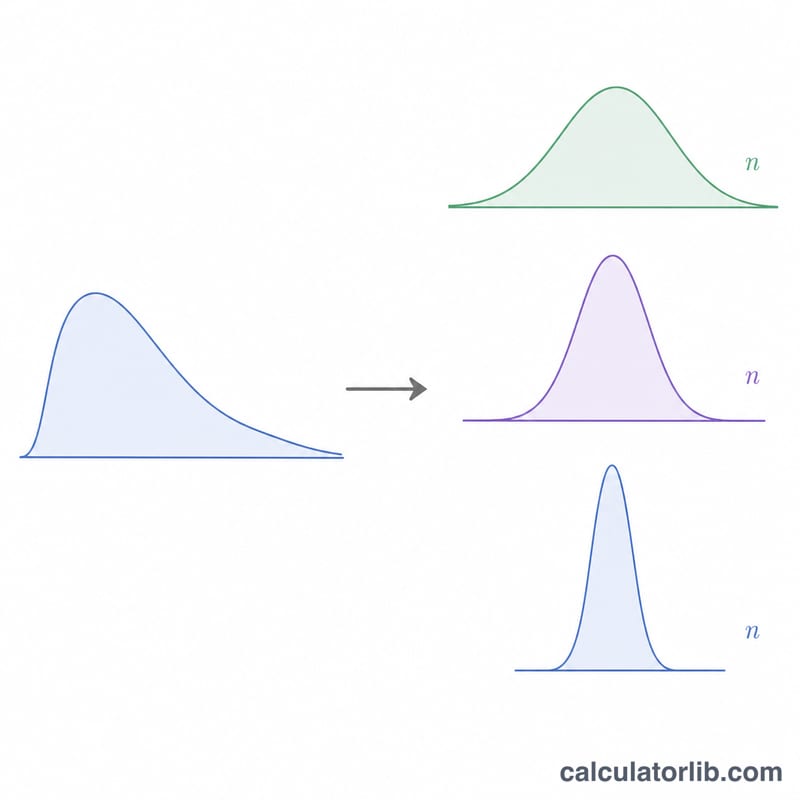
The Central Limit Theorem (CLT) is a cornerstone of statistics. It states that when you take repeated random samples of size n from any population with mean μ and standard deviation σ, the distribution of the sample means becomes approximately normal as n grows — regardless of the shape of the original population. This calculator gives you the two key parameters of that sampling distribution: its mean and its standard error.
How to use this calculator
Enter the population mean (μ), the population standard deviation (σ), and your sample size (n). The tool returns the mean of the sampling distribution (which equals μ), the standard error of the mean (SE), and the variance of the sample mean (σ²/n). A common rule of thumb is that n ≥ 30 makes the normal approximation reliable.
The formula explained
The CLT tells us two things about the sampling distribution of the mean. First, its center is the same as the population: \(\mu_{\bar{x}} = \mu\). Second, its spread shrinks as samples get larger: \(SE = \sigma / \sqrt{n}\). Because dividing by \(\sqrt{n}\) reduces variability, larger samples give more precise estimates of the true mean. The variance of the sample mean is simply the square of the standard error, \(\sigma^{2}/n\).
$$\mu_{\bar{x}} = \text{Mean }(\mu) \qquad SE = \frac{\text{SD }(\sigma)}{\sqrt{\text{Sample size }(n)}}$$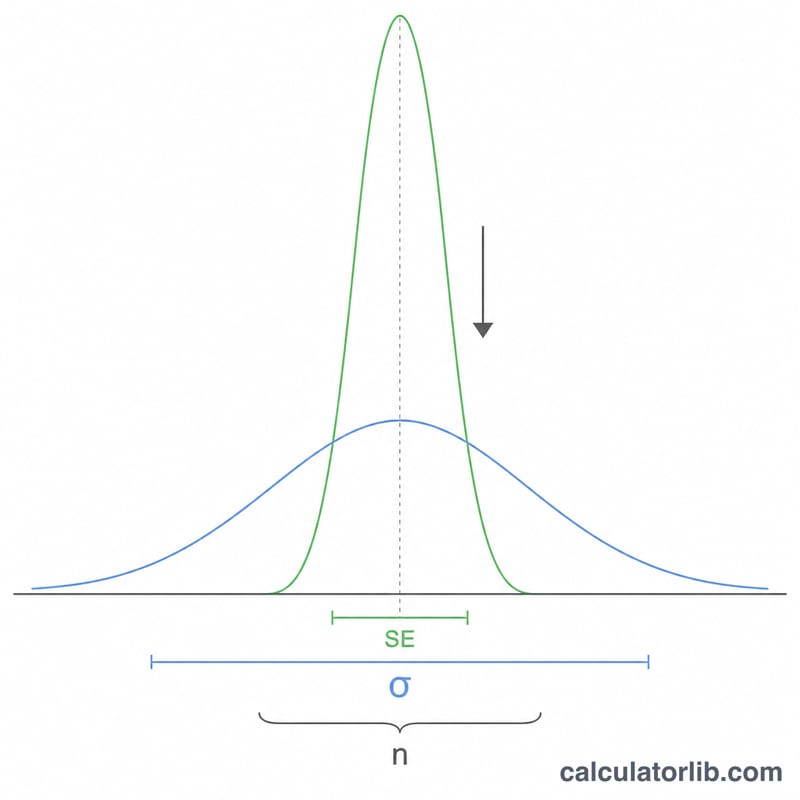
Worked example
Suppose a population has μ = 100 and σ = 15, and you draw samples of size n = 36. Then \(\mu_{\bar{x}} = 100\), and
$$SE = \frac{15}{\sqrt{36}} = \frac{15}{6} = 2.5$$The variance of the sample mean is
$$\frac{15^{2}}{36} = \frac{225}{36} = 6.25$$So sample means cluster tightly around 100 with a standard error of just 2.5.
FAQ
Does the population have to be normal? No. That is the power of the CLT — for large enough n the sampling distribution of the mean is approximately normal even if the population is skewed.
What sample size is "large enough"? A common guideline is n ≥ 30, though heavily skewed populations may need more.
Why does the standard error get smaller with bigger samples? Averaging more observations cancels out random noise, so the mean estimate becomes more stable as n increases.