What Is the Upper Fence?
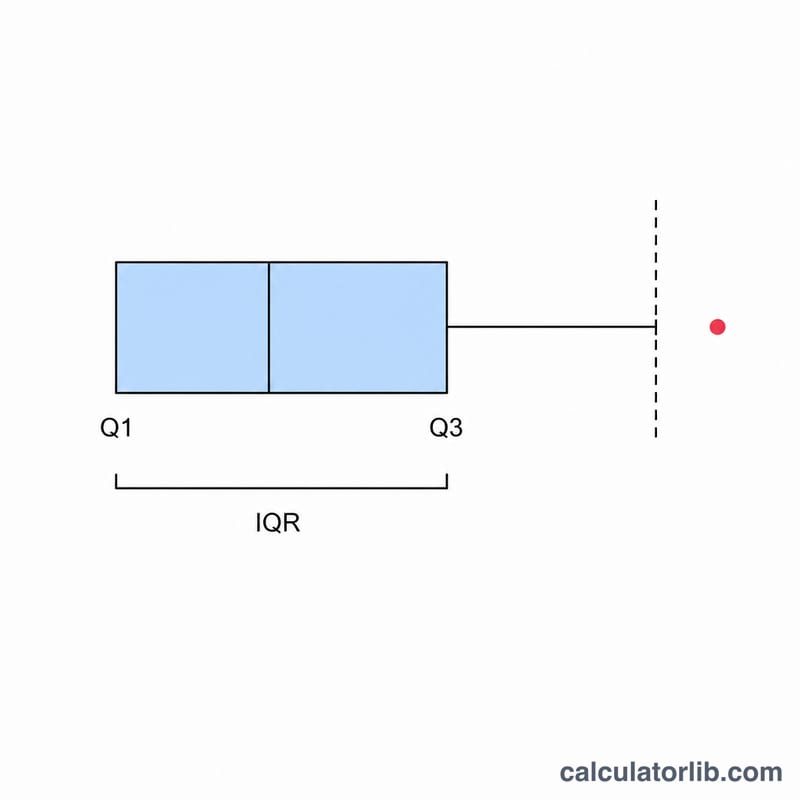
The upper fence is a statistical boundary used to identify high-side outliers in a data set. Any value that lies above the upper fence is flagged as a potential outlier and may warrant closer inspection. It is part of the classic Tukey method for outlier detection, the same approach that draws the "whiskers" on a box-and-whisker plot.
How to Use This Calculator
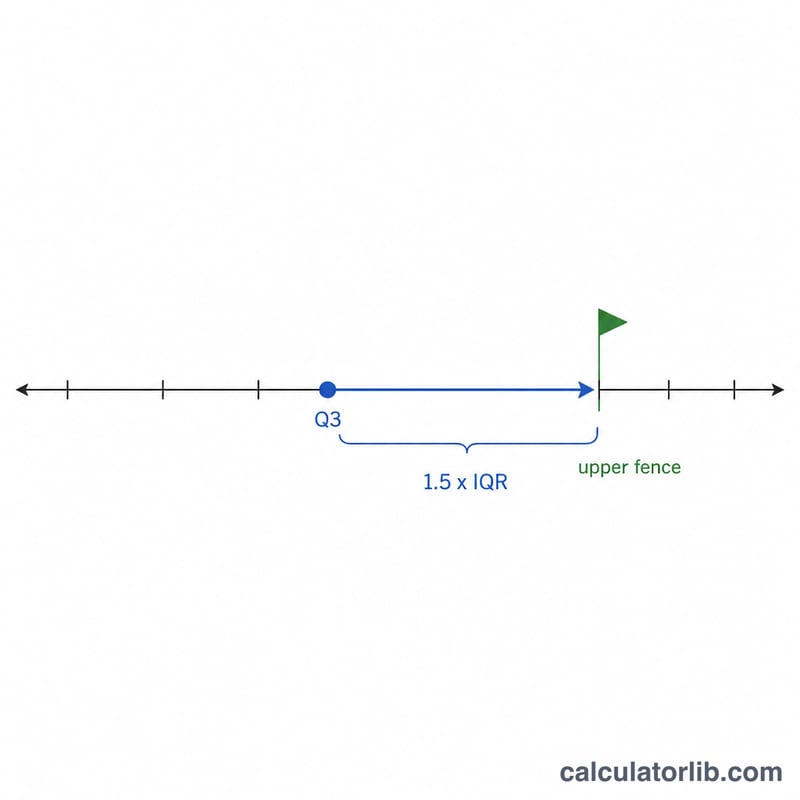
Enter the first quartile (Q1) and third quartile (Q3) of your data set. The calculator computes the interquartile range (IQR = Q3 − Q1), multiplies it by 1.5, and adds the result to Q3 to produce the upper fence. If you don't already know your quartiles, sort your data and find the median of the lower half (Q1) and the median of the upper half (Q3).
The Formula Explained
The upper fence is defined as $$\text{Upper Fence} = \text{Q3} + 1.5 \times \left(\text{Q3} - \text{Q1}\right)$$ The quantity \(\text{Q3} - \text{Q1}\) is the interquartile range, a robust measure of spread that ignores extreme values. Multiplying the IQR by 1.5 gives a tolerance band; extending that band above Q3 sets the cutoff for unusually large observations.
Worked Example
Suppose a data set has \(\text{Q1} = 25\) and \(\text{Q3} = 75\). The IQR is \(75 - 25 = 50\). The upper fence is $$75 + 1.5 \times 50 = 75 + 75 = 150.$$ Any data point greater than 150 would be considered a potential high outlier.
FAQ
Why 1.5? The factor 1.5 is the standard multiplier introduced by John Tukey. It balances sensitivity and false positives for roughly normal data. A multiplier of 3.0 is sometimes used to flag "extreme" outliers.
What about the lower fence? The matching lower boundary is \(\text{Q1} - 1.5 \times \text{IQR}\). Values below it are low-side outliers.
Does a value above the fence always mean an error? No. It only flags the point for review — it could be a genuine but extreme observation.


