What Is the Lower Fence?
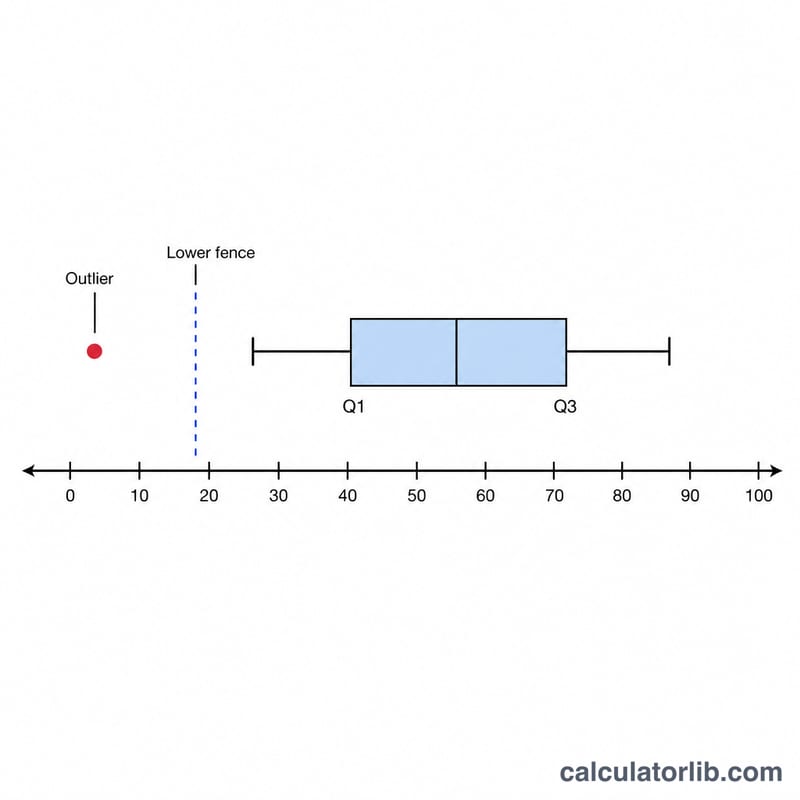
The lower fence is a statistical boundary used to detect outliers on the low end of a data set. Any value that falls below the lower fence is flagged as a potential outlier. It is part of the standard 1.5 \(\times\) IQR rule popularized by John Tukey and is the same calculation that draws the whiskers and identifies outliers in a box-and-whisker plot.
How to Use This Calculator
Enter the first quartile (Q1) and the third quartile (Q3) of your data set. The calculator computes the interquartile range (IQR = Q3 \(-\) Q1), multiplies it by 1.5, and subtracts that amount from Q1 to return the lower fence. Use it together with the upper fence to bracket the range of "normal" values.
The Formula Explained
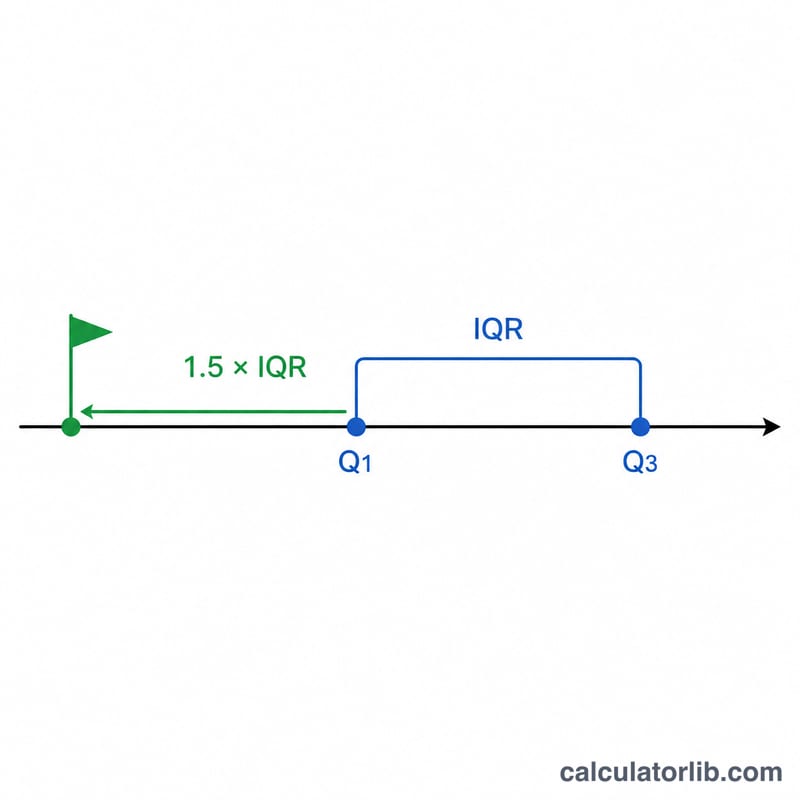
The formula is $$\text{Lower Fence} = \text{Q1} - 1.5 \times \left( \text{Q3} - \text{Q1} \right)$$ First find the IQR by subtracting Q1 from Q3. The factor 1.5 sets how aggressively outliers are detected — a larger factor (such as 3.0) flags only extreme outliers, while 1.5 is the conventional choice for "mild" outliers.
Worked Example
Suppose a data set has Q1 = 25 and Q3 = 75. The IQR is \(75 - 25 = 50\). Multiply by 1.5 to get 75, then subtract from Q1: $$25 - 75 = -50$$ Any observation below \(-50\) is a potential low-end outlier.
FAQ
What does a negative lower fence mean? It simply means that no realistic small value would be flagged as a low outlier — the boundary is below your data's range, which is common when the data is symmetric or right-skewed.
How do I get Q1 and Q3? Sort your data, then find the median of the lower half (Q1) and the median of the upper half (Q3). Many spreadsheets provide a QUARTILE function.
Why 1.5 times the IQR? It is a widely accepted convention that balances sensitivity and false positives for roughly normal data. Use 3.0 \(\times\) IQR if you only want to capture extreme outliers.


