
What Is the Point Estimate Calculator?
A point estimate is a single best-guess value for an unknown population parameter — here, a proportion. Given x successes out of n trials, this calculator returns several common point estimates of the true proportion p. The most familiar is the Maximum Likelihood Estimate (MLE), simply \(x/n\), but small samples or extreme counts (0 or n successes) benefit from smoothed estimators like Laplace, Jeffreys, and the Wilson-adjusted estimate.
How to Use It
Enter the number of successes (x) and the total number of trials (n). The calculator instantly reports the raw sample proportion plus three corrected estimates. Use the MLE for large, well-behaved samples; prefer Laplace or Wilson when n is small or x is near 0 or n, because those avoid returning exactly 0 or 1.
The Formulas Explained
MLE:
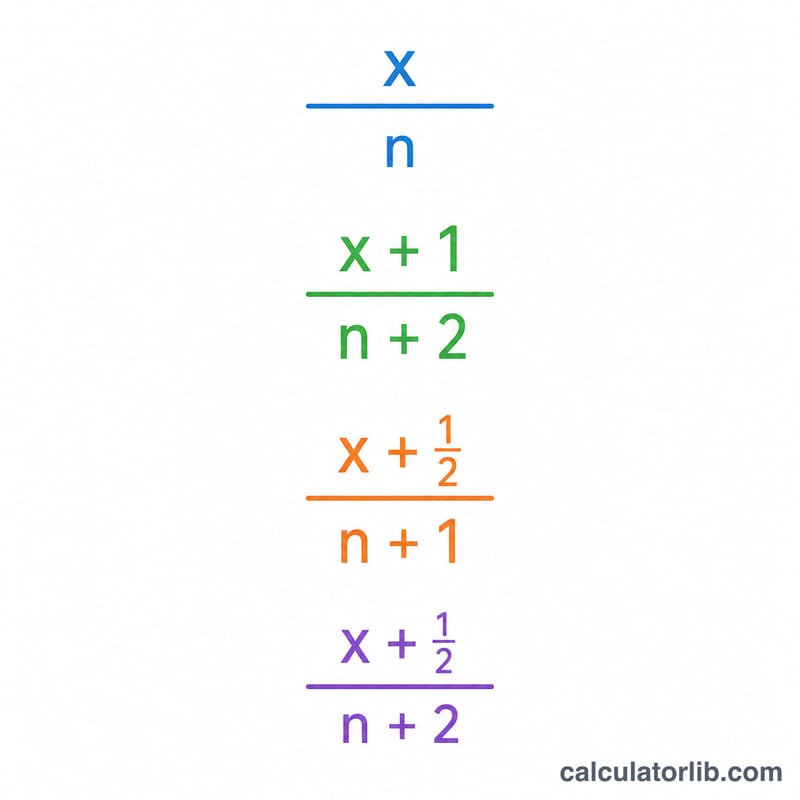
$$\hat{p}_{\text{MLE}} = \frac{\text{Successes }(x)}{\text{Trials }(n)}$$Laplace ("add-one"):
$$\hat{p}_{\text{Laplace}} = \frac{\text{Successes }(x) + 1}{\text{Trials }(n) + 2}$$Jeffreys:
$$\hat{p}_{\text{Jeffreys}} = \frac{\text{Successes }(x) + 0.5}{\text{Trials }(n) + 1}$$Wilson point estimate:
$$\hat{p}_{\text{Wilson}} = \frac{\text{Successes }(x) + \frac{z^{2}}{2}}{\text{Trials }(n) + z^{2}}, \quad z = 1.96$$the center of the Wilson score interval, with \(z = 1.96\) for 95% confidence. Each smoothing term pulls the estimate gently toward 0.5, reducing bias and variance for small samples.
Worked Example
Suppose 8 of 10 trials succeed.
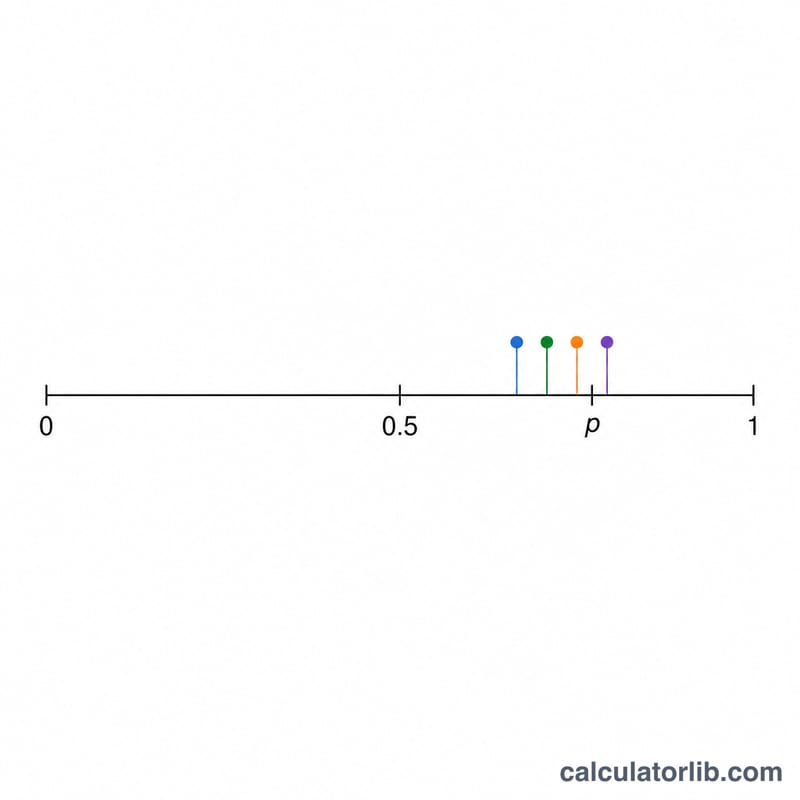
$$\text{MLE} = 8/10 = 0.8$$$$\text{Laplace} = (8+1)/(10+2) = 9/12 = 0.75$$$$\text{Jeffreys} = (8+0.5)/(10+1) = 8.5/11 \approx 0.7727$$Wilson with \(z^2 = 3.8416\):
$$(8 + 1.9208)/(10 + 3.8416) = 9.9208/13.8416 \approx 0.7168$$The smoothed estimates pull the 0.8 raw value toward the middle.
FAQ
Which estimate should I report? For most reporting, the MLE (sample proportion) is standard. For small samples or rare events, Laplace or Wilson are more reliable.
Why does Wilson use z? Wilson's point estimate is the midpoint of the Wilson score confidence interval, which depends on the z-value for your chosen confidence level (\(1.96 \approx 95\%\)).
What if x = 0 or x = n? The MLE gives 0 or 1, which is often implausible; the smoothed estimators return values strictly between 0 and 1.