
What Is a Pivot Point Calculator?
A pivot point calculator computes key intraday price levels traders use to gauge potential support and resistance. Based on the previous period's high, low and close, it produces a central pivot (PP) plus three resistance levels (R1, R2, R3) and three support levels (S1, S2, S3). These levels are widely used in stocks, forex and futures day trading. This tool uses the classic (standard) pivot point method.
How to Use It
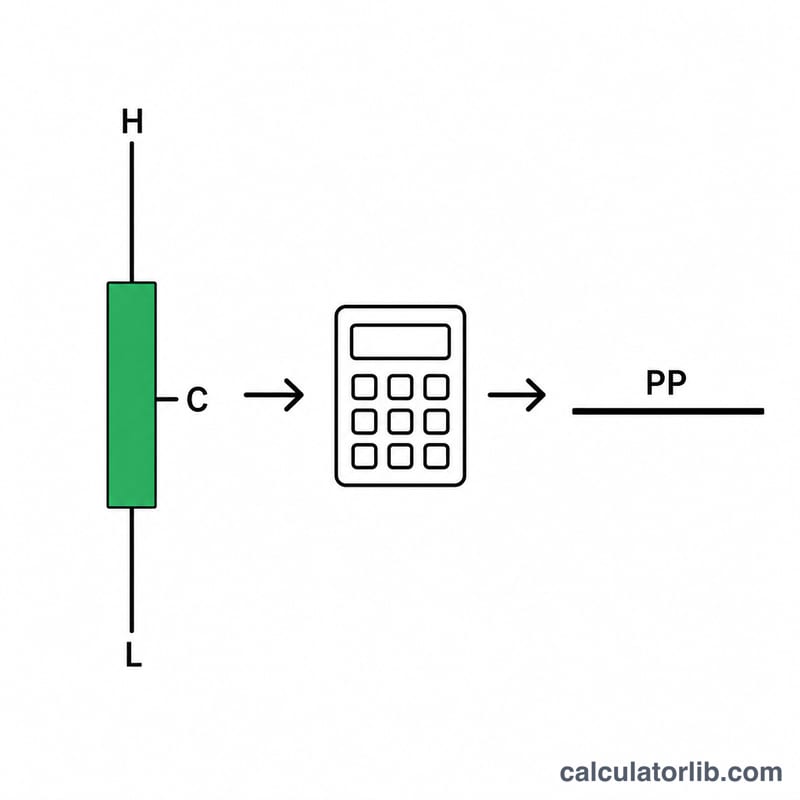
Enter the prior period's High, Low and Close prices — typically yesterday's daily values for an intraday plan, or the previous week/month for longer-term levels. Click calculate and the tool instantly returns the pivot and all support/resistance lines. Plot these on your chart: price trading above PP suggests bullish bias, below PP bearish bias.
The Formula Explained
The pivot itself is the simple average of high, low and close: \(PP = \dfrac{H + L + C}{3}\). The other levels build outward:
$$\begin{aligned} R1 &= 2\cdot PP - \text{Low} \\ S1 &= 2\cdot PP - \text{High} \\ R2 &= PP + (\text{High} - \text{Low}) \\ S2 &= PP - (\text{High} - \text{Low}) \\ R3 &= \text{High} + 2\cdot(PP - \text{Low}) \\ S3 &= \text{Low} - 2\cdot(\text{High} - PP) \end{aligned}$$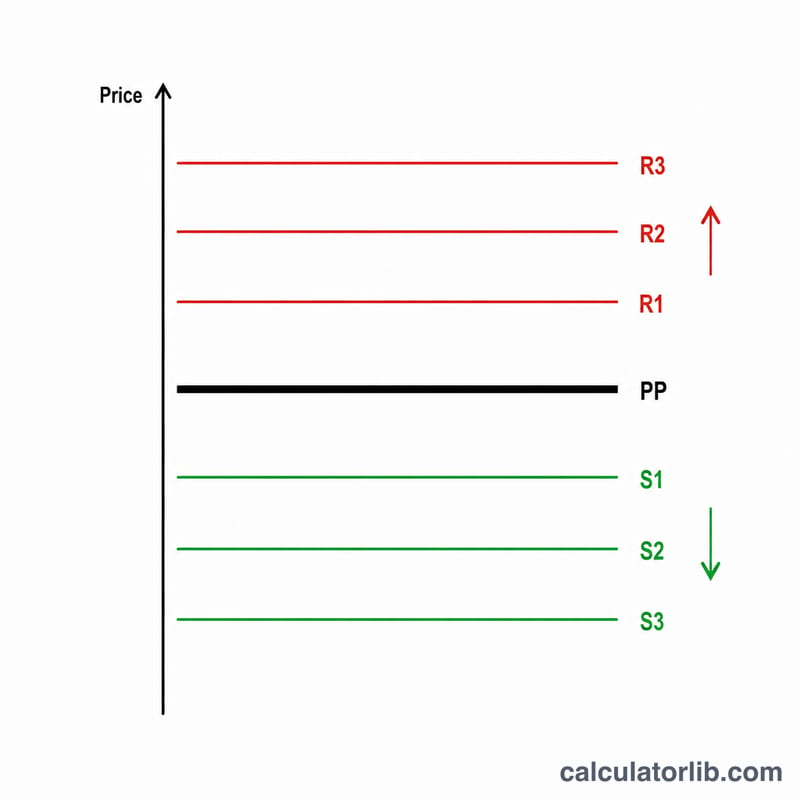
Worked Example
Suppose yesterday's High = 110, Low = 90, Close = 105. Then $$PP = \frac{110 + 90 + 105}{3} = \frac{305}{3} = 101.6667.$$ \(R1 = 2\cdot 101.6667 - 90 = 113.3333\), \(S1 = 2\cdot 101.6667 - 110 = 93.3333\), \(R2 = 101.6667 + 20 = 121.6667\), \(S2 = 101.6667 - 20 = 81.6667\).
FAQ
Which prices should I use? Use the previous completed period's high, low and close. For day trading that's the prior trading day.
Are pivot points reliable? They're a popular reference for likely turning points but should be combined with other analysis and risk management.
What pivot type is this? This calculator uses the classic/standard pivot formula. Other variants (Fibonacci, Camarilla, Woodie) use different multipliers.