
What Is Youden's J Index?
Youden's J index (also called Youden's index or J statistic) is a single number that summarises the performance of a binary diagnostic test. Introduced by W. J. Youden in 1950, it combines a test's sensitivity (true positive rate) and specificity (true negative rate) into one value ranging from −1 to 1. A value of 1 indicates a perfect test with no false positives or false negatives, while 0 means the test performs no better than random chance.
How to Use This Calculator
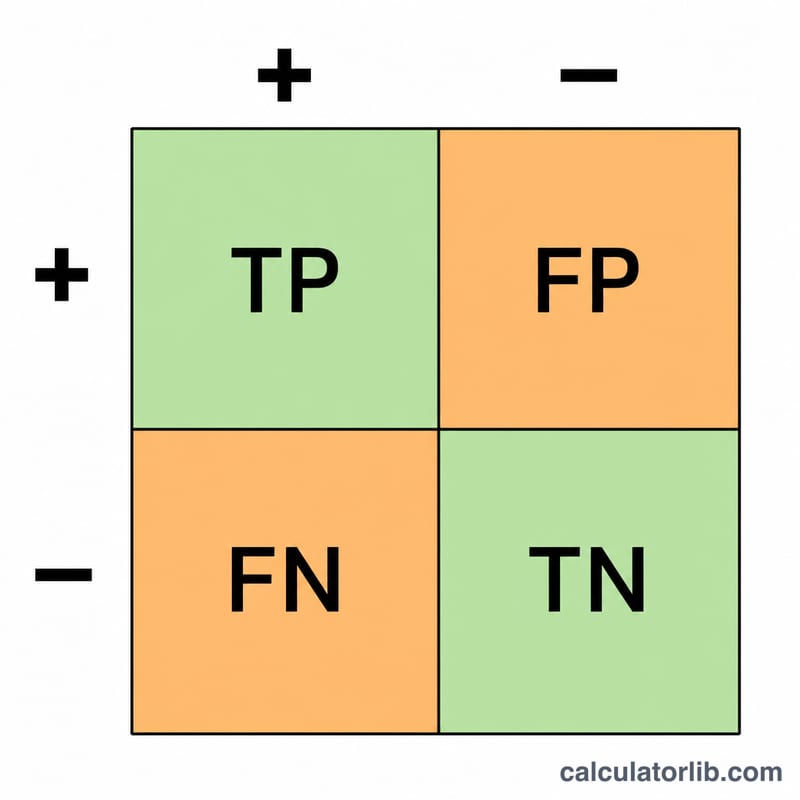
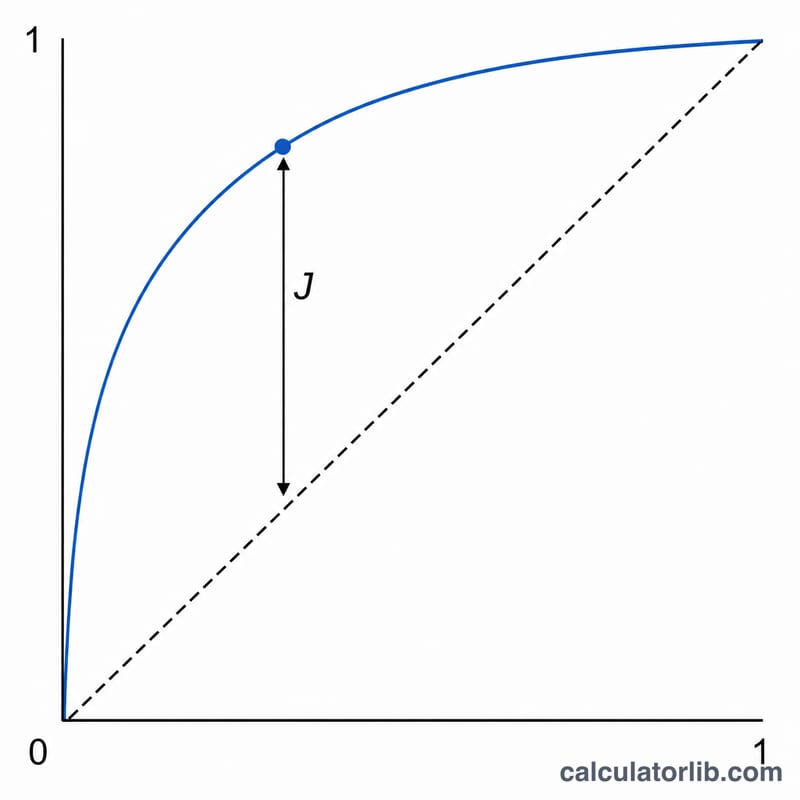
Enter the four counts from your 2×2 confusion matrix: True Positives (TP), False Negatives (FN), True Negatives (TN) and False Positives (FP). The calculator derives sensitivity and specificity, then returns Youden's J index. It is commonly used to choose an optimal cut-off point on an ROC curve — the threshold that maximises J is often the best operating point.
The Formula Explained
Sensitivity \( = \dfrac{\text{TP}}{\text{TP} + \text{FN}} \) is the proportion of actual positives correctly identified. Specificity \( = \dfrac{\text{TN}}{\text{TN} + \text{FP}} \) is the proportion of actual negatives correctly identified. Youden's J is simply
$$J = \text{Sensitivity} + \text{Specificity} - 1$$
Because each rate lies between 0 and 1, J lies between −1 and 1.
Worked Example
Suppose a test gives TP = 90, FN = 10, TN = 80, FP = 20. Sensitivity \( = 90 / 100 = 0.90 \) and specificity \( = 80 / 100 = 0.80 \). Then
$$J = 0.90 + 0.80 - 1 = 0.70$$
indicating a strong but not perfect test.
FAQ
What is a good Youden's J value? Higher is better; values near 1 indicate excellent discrimination, while values near 0 indicate poor discrimination.
Can J be negative? Yes. A negative J means the test performs worse than chance, often suggesting reversed labels.
How does J relate to the ROC curve? J equals the maximum vertical distance between the ROC curve and the diagonal line of no discrimination, so the threshold maximising J is a popular optimal cut-off.