What Is the PERT Estimate Calculator?
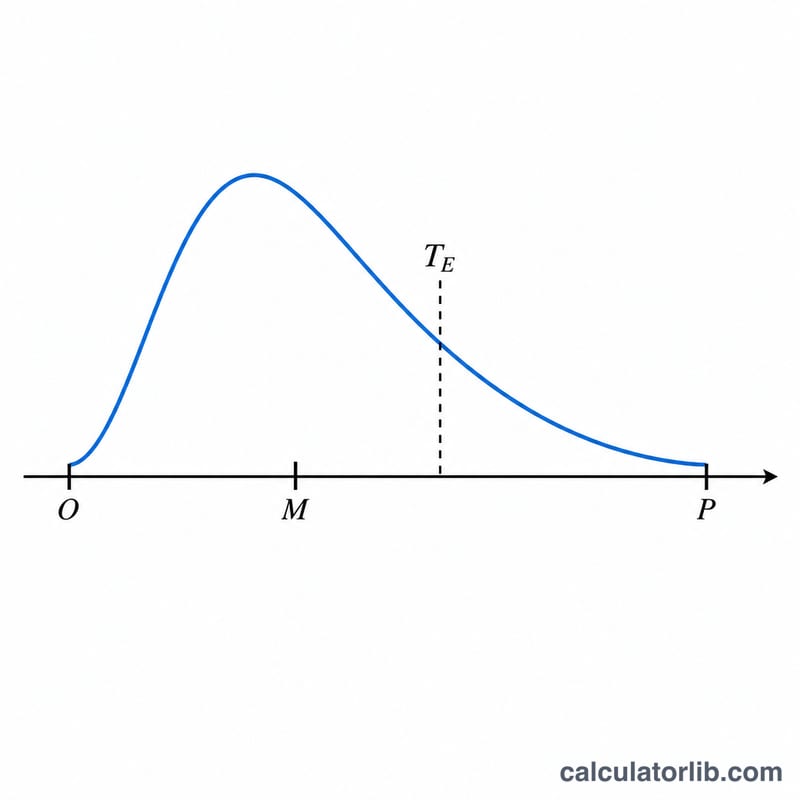
The PERT (Program Evaluation and Review Technique) calculator turns three time guesses into a single, statistically-weighted estimate. Instead of relying on one number, you provide an Optimistic (O), Most Likely (M), and Pessimistic (P) duration. The tool returns the Expected Time (TE), the Standard Deviation (SD), and the Variance — giving you both a realistic estimate and a measure of its uncertainty. It works for any unit of time (hours, days, weeks) as long as you stay consistent.
How to Use It
Enter your three estimates for a task. The Optimistic value is the best-case duration if everything goes smoothly, the Most Likely is your realistic call, and the Pessimistic is the worst-case scenario. Press calculate to see the weighted expected time and how much it might vary.
The Formula Explained
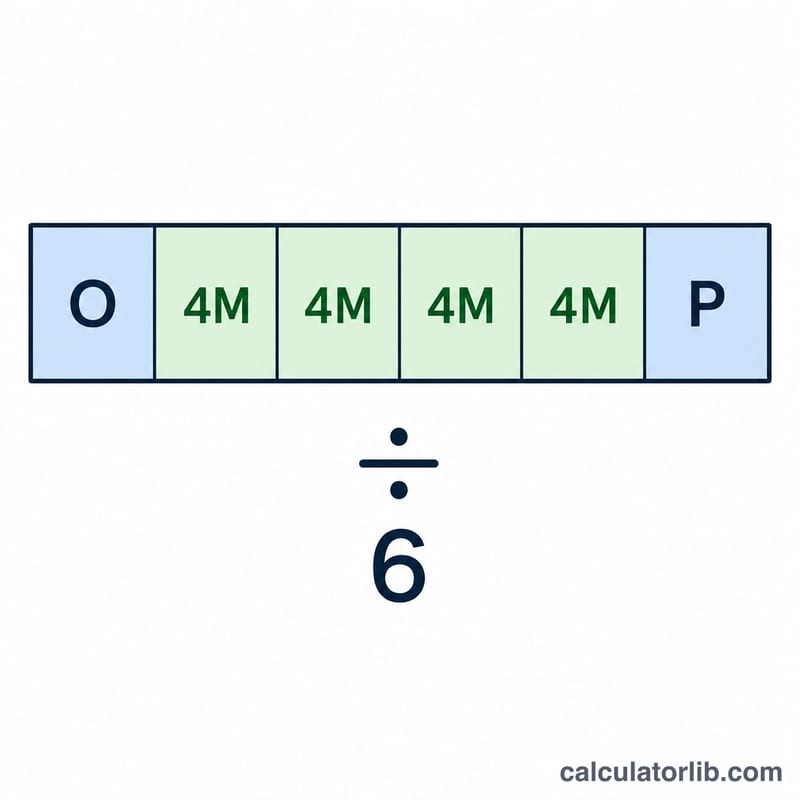
PERT uses a beta distribution and weights the most likely estimate four times more heavily than the extremes:
$$TE = \frac{\text{Optimistic (O)} + 4 \times \text{Most Likely (M)} + \text{Pessimistic (P)}}{6}$$
The spread of possible outcomes is captured by the standard deviation:
$$SD = \frac{\text{Pessimistic (P)} - \text{Optimistic (O)}}{6}$$
Variance is simply \(SD^{2}\). A large standard deviation signals a risky task that deserves a buffer.
Worked Example
Suppose a feature takes 4 days optimistically, 7 days most likely, and 16 days pessimistically. Then $$TE = \frac{4 + 4 \times 7 + 16}{6} = \frac{4 + 28 + 16}{6} = \frac{48}{6} = 8 \text{ days}.$$ $$SD = \frac{16 - 4}{6} = \frac{12}{6} = 2 \text{ days},$$ so variance \(= 4\). You would plan for 8 days, knowing roughly ±2 days of uncertainty.
FAQ
Why is M multiplied by 4? The beta distribution assumes the most likely value dominates, so it carries four-sixths of the weight while O and P share the rest.
What units should I use? Any consistent time unit — hours, days, or weeks. The output uses the same unit as your inputs.
How do I combine many tasks? Sum the TE values for the total expected duration, and sum the individual variances (not standard deviations) before taking the square root for the overall SD.


