
What Are Degrees of Freedom?
Degrees of freedom (df) represent the number of independent values in a statistical calculation that are free to vary. In hypothesis testing, df determines which row of a t-distribution (or chi-square / F-distribution) table you use to find critical values and p-values. This calculator covers the two most common cases: the one-sample t-test and the two-sample (independent) t-test assuming equal variances.
How to Use This Calculator
Choose your test type. For a one-sample test, enter the sample size n. For a two-sample test, enter both sample sizes n1 and n2. The calculator returns the degrees of freedom you should use when looking up critical values for your test.
The Formula Explained
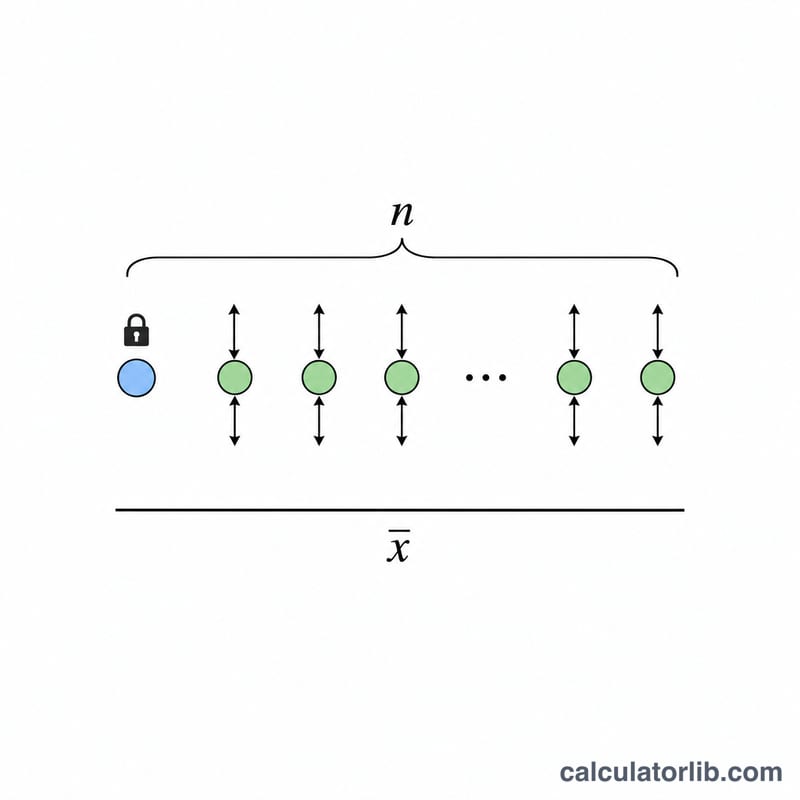
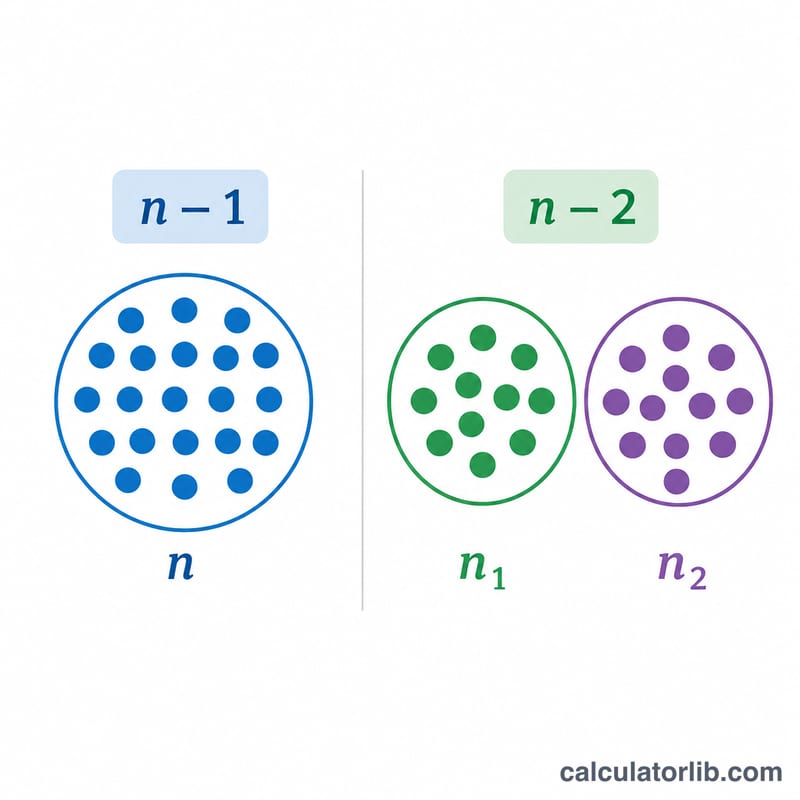
For a single sample, you estimate one parameter (the mean), so you lose one degree of freedom: $$df = \text{n} - 1$$ For two independent samples, you estimate two means, losing two degrees of freedom: $$df = \text{n}_1 + \text{n}_2 - 2$$ This pooled-variance formula assumes the two populations have equal variances.
Worked Example
Suppose Group A has 15 observations and Group B has 18 observations, and you run an independent two-sample t-test. The degrees of freedom are: $$df = 15 + 18 - 2 = 31$$ You would then look up the t-critical value for 31 df at your chosen significance level.
FAQ
Why subtract 1 for one sample? Because the sample mean is computed from the data, only \(\text{n} - 1\) of the values can vary freely once the mean is fixed.
What if my two samples have unequal variances? Then use Welch's t-test, which uses a more complex df formula (the Welch–Satterthwaite equation) rather than \(\text{n}_1 + \text{n}_2 - 2\).
Can df be a fraction? In these pooled and one-sample cases, no — df is always a whole number. Fractional df only appears with Welch's approximation.