
What Is Covariance?
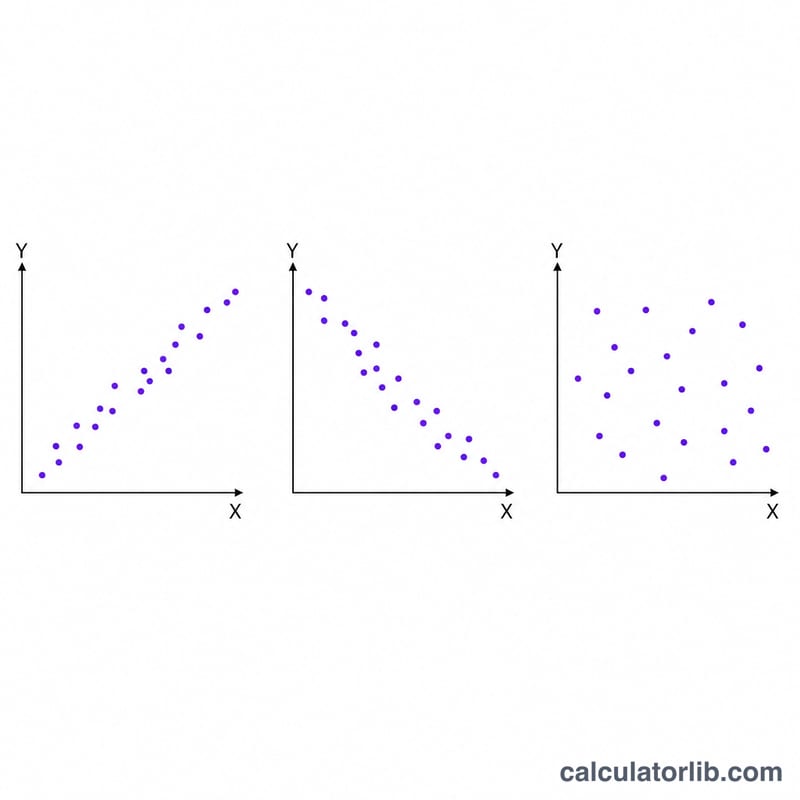
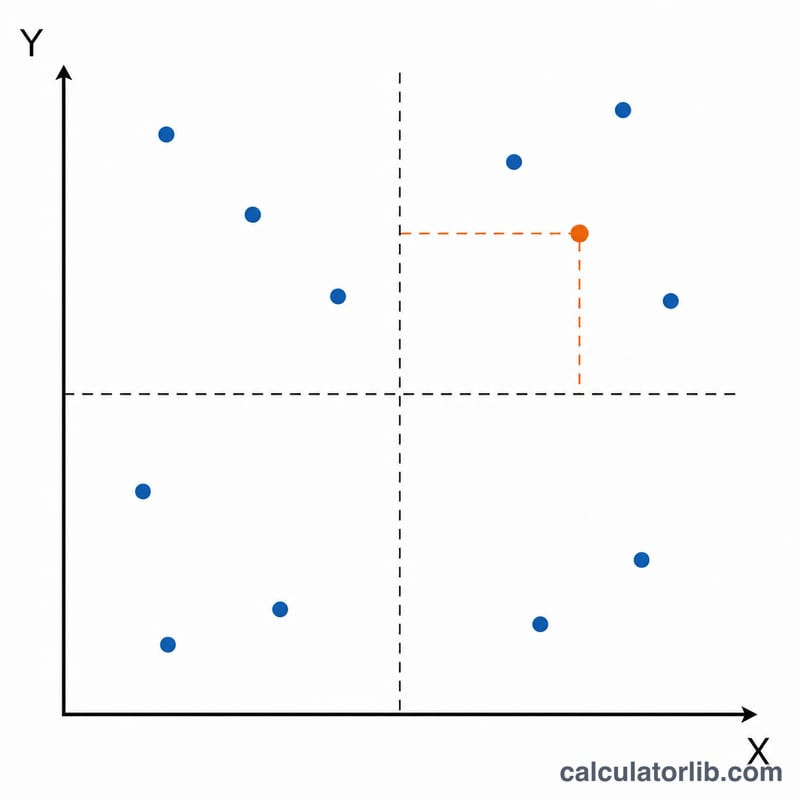
Covariance measures how two variables change together. When two variables tend to increase at the same time, the covariance is positive. When one rises as the other falls, the covariance is negative. A value close to zero suggests there is little linear relationship between the two variables. Unlike correlation, covariance is not standardized, so its size depends on the units of your data — but its sign still tells you the direction of the relationship.
This calculator computes sample covariance, which divides by \((n - 1)\) rather than \(n\). The \((n - 1)\) adjustment, known as Bessel's correction, gives an unbiased estimate when your data is a sample drawn from a larger population.
How to Use the Calculator
- Enter your X values as a comma-separated list (for example: 2, 4, 6, 8).
- Enter your Y values as a comma-separated list of the same length (for example: 1, 3, 2, 5).
- Click calculate to see the sample covariance.
Both lists must contain the same number of values, since each X is paired with its matching Y. Make sure there are no blank entries or extra commas.
The Sample Covariance Formula
The formula used is:
$$\text{cov}(X, Y) = \frac{\displaystyle\sum_{i=1}^{n}\left(x_i - \bar{x}\right)\left(y_i - \bar{y}\right)}{n - 1}$$
Here, \(\bar{x}\) and \(\bar{y}\) are the means of the X and Y values, \(n\) is the number of data pairs, and the summation adds up the product of each point's deviation from its own mean.
Worked Example
Suppose X = 2, 4, 6, 8 and Y = 1, 3, 2, 5.
- Mean of X = 5; Mean of Y = 2.75.
- Deviation products: $$(-3)(-1.75) + (-1)(0.25) + (1)(-0.75) + (3)(2.25) = 5.25 - 0.25 - 0.75 + 6.75 = 11.$$
- Divide by \((n - 1) = 3\): \(\text{covariance} = 11 / 3 \approx 3.67\).
The positive result confirms that X and Y tend to rise together.
Frequently Asked Questions
What is the difference between sample and population covariance? Sample covariance divides by \((n - 1)\) and is used when your data represents a sample. Population covariance divides by \(n\) and is used when you have data for an entire population.
Can covariance be greater than 1? Yes. Covariance is not bounded between \(-1\) and \(1\) — that range applies to the correlation coefficient. Covariance can take any value depending on data scale.
How is covariance related to correlation? Correlation is covariance divided by the product of the two standard deviations, producing a standardized value between \(-1\) and \(1\).