
What This Variance Calculator Does
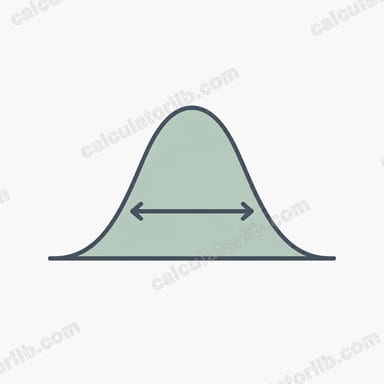
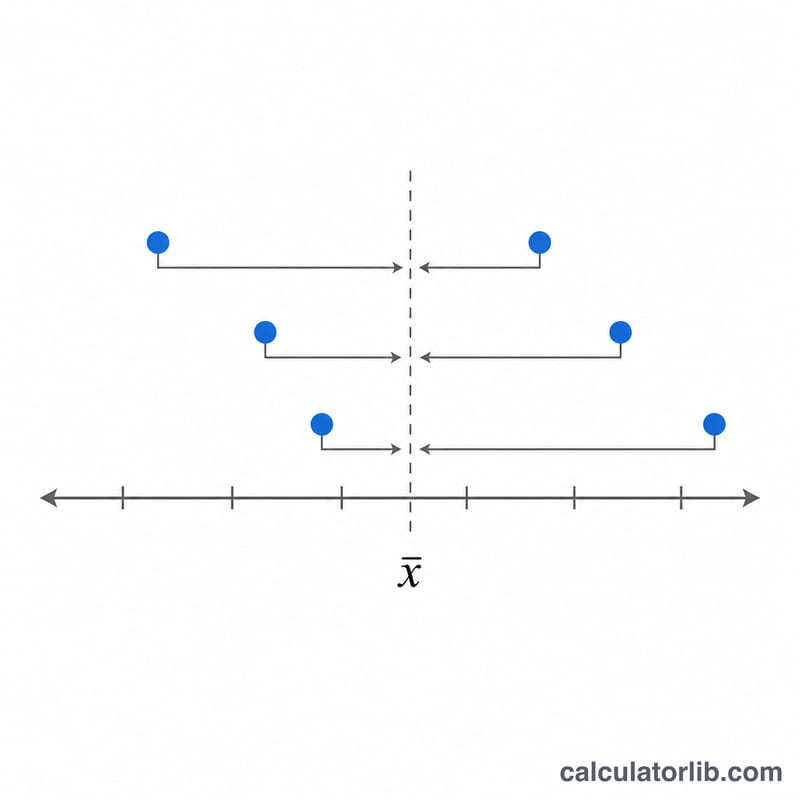
Variance measures how spread out a set of numbers is around their average (mean). A small variance means the values cluster tightly near the mean; a large variance means they are scattered widely. This calculator takes a single list of comma-separated numbers and returns the mean, the variance, and the standard deviation in one step — so you can instantly judge the consistency or volatility of your data.
How to Use It
There is just one input field: Enter numbers (comma-separated). Type or paste your data points separated by commas, semicolons, spaces, or even full-width commas — for example 4, 8, 15, 16, 23, 42. The tool splits the text, converts each entry to a number, and computes:
- Mean — the arithmetic average of all values.
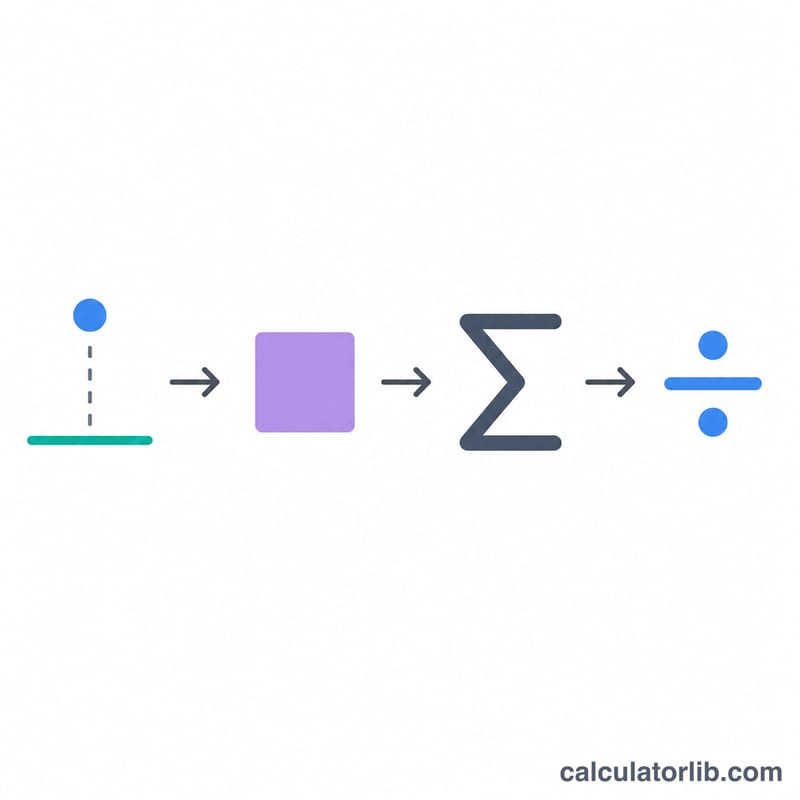
- Variance — the average squared deviation from the mean.
- Standard deviation — the square root of the variance, in the same units as your data.
The Formula Behind It
This calculator uses the Apache Commons Math StatUtils.variance method, which computes the sample variance (dividing by n − 1, not n). The formula is:
where \(x_i\) is each value, \(\bar{x}\) is the mean, and \(n\) is the number of values. The standard deviation is simply \(s = \sqrt{s^2}\). Using \(n - 1\) (Bessel's correction) gives an unbiased estimate of the variance for a sample drawn from a larger population.
Worked Example
Suppose you enter 2, 4, 6, 8:
- Mean = \((2 + 4 + 6 + 8) / 4 = \mathbf{5}\)
- Squared deviations: \((2-5)^2=9\), \((4-5)^2=1\), \((6-5)^2=1\), \((8-5)^2=9\) → sum = 20
- Sample variance = \(20 / (4 - 1) = \mathbf{6.667}\)
- Standard deviation = \(\sqrt{6.667} \approx \mathbf{2.582}\)
The calculator returns all three figures automatically.
Frequently Asked Questions
Does this use sample or population variance? It computes sample variance, dividing by n − 1. This is the standard choice when your numbers represent a sample rather than an entire population.
What separators can I use? Commas, semicolons, spaces, and full-width Asian-style commas all work, so messy pasted data is usually parsed correctly.
Why is standard deviation also shown? Standard deviation is easier to interpret because it shares the same units as your original data, while variance is in squared units.