What is the Variance and Standard Deviation Calculator?
This calculator takes a list of numbers and computes both the population and sample variance, along with their corresponding standard deviations. Variance measures how far each value lies from the mean, while standard deviation expresses that spread in the original units of the data.
How to use it
Enter your data set separated by commas or spaces (for example 4, 8, 15, 16, 23, 42) and submit. The tool returns the mean, sum, sum of squares, both variances, and both standard deviations.
The formula explained
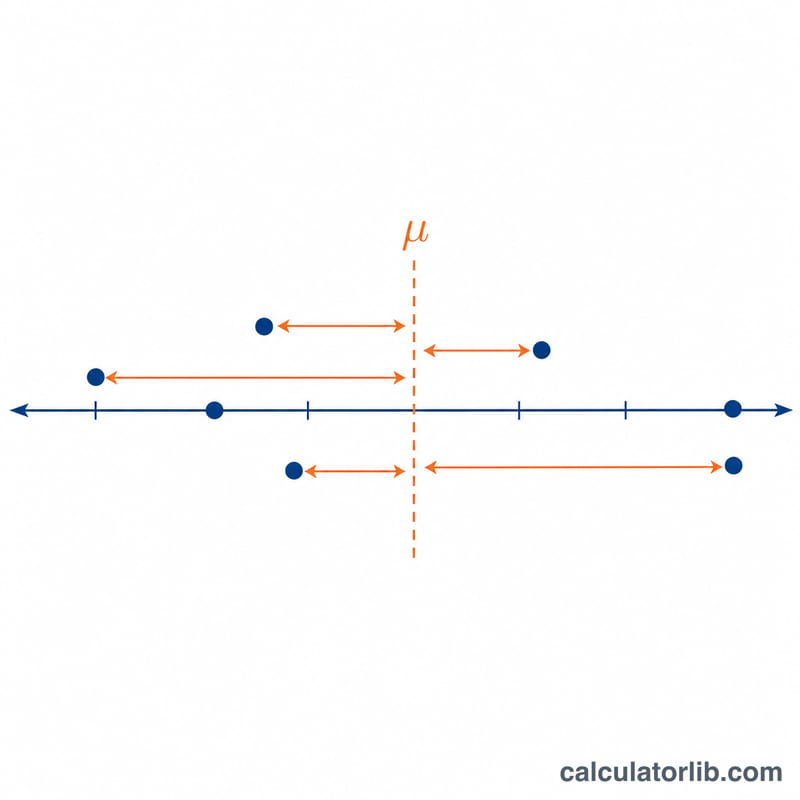
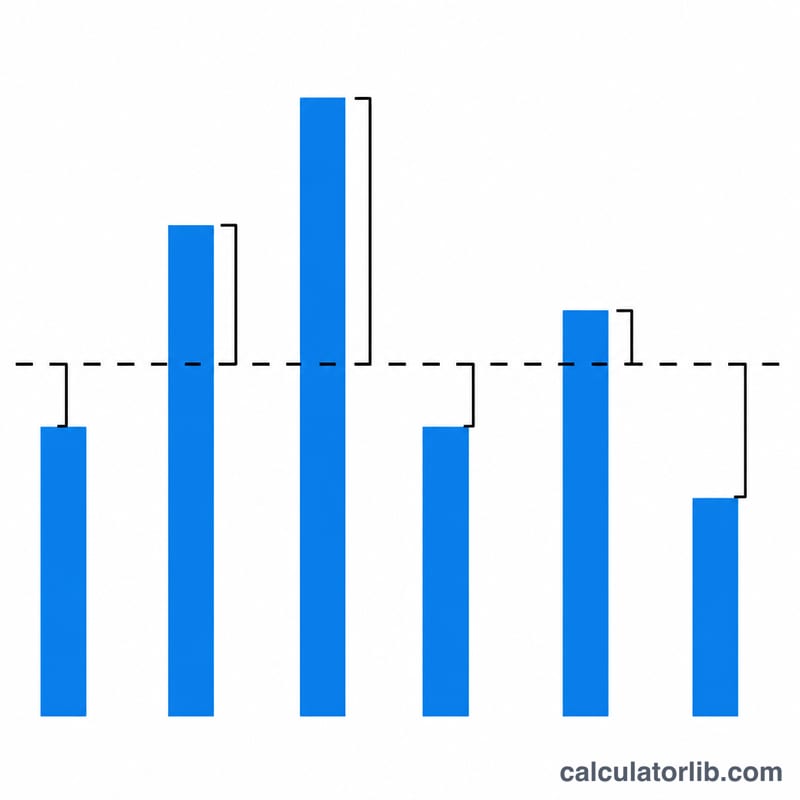
The population variance divides the sum of squared deviations by N: $$\sigma^2 = \frac{\sum (x_i - \mu)^2}{N}.$$ The sample variance uses \(n - 1\) (Bessel correction) to give an unbiased estimate from a sample: $$s^2 = \frac{\sum (x_i - \bar{x})^2}{n - 1}.$$ Standard deviation is simply the square root of the variance.
Worked example
For 4, 8, 15, 16, 23, 42 the mean is \(108/6 = 18\). The squared deviations sum to \(196 + 100 + 9 + 4 + 25 + 576 = 910\)... wait, recompute: \((4-18)^2=196\), \((8-18)^2=100\), \((15-18)^2=9\), \((16-18)^2=4\), \((23-18)^2=25\), \((42-18)^2=576\), sum = 910. Population variance = $$\frac{910}{6} \approx 151.67.$$ The sample variance = $$\frac{910}{5} = 182.$$
FAQ
When should I use sample vs population variance? Use population variance when your data covers the entire group; use sample variance when your data is a sample drawn from a larger population.
Why divide by n − 1? Dividing by \(n - 1\) corrects the downward bias that occurs when estimating a population variance from a sample.
Can I use negative numbers? Yes, any real numbers are accepted.


