What is the Shannon Diversity Index?
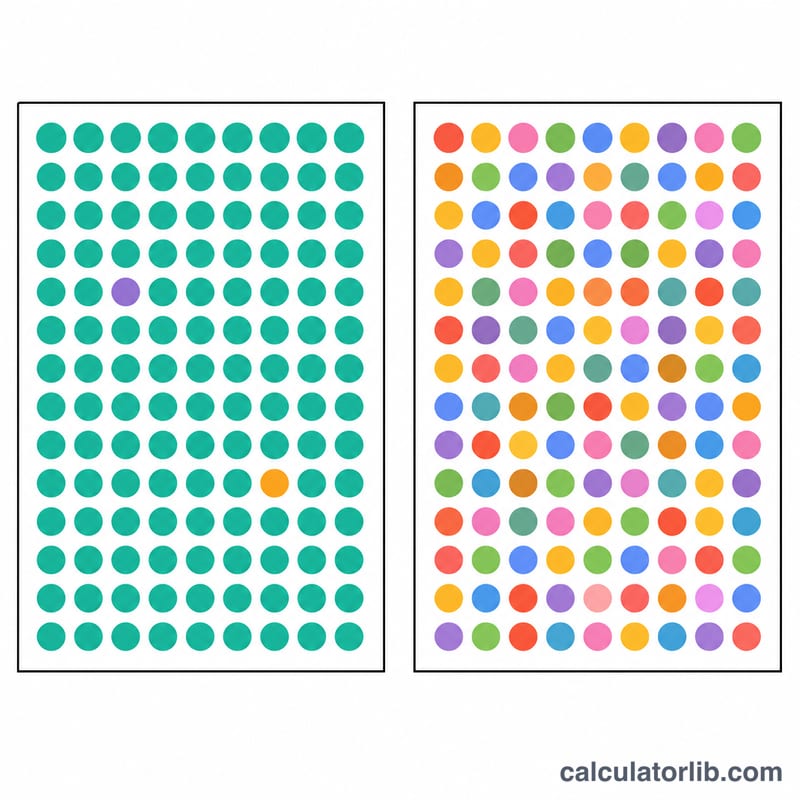
The Shannon diversity index (often written H or H′) is a widely used measure of biodiversity in ecology. It combines two components of a community: species richness (how many different species are present) and evenness (how equally individuals are distributed among those species). A community with many species in balanced proportions scores high; one dominated by a single species scores low.
How to use this calculator
Enter the number of individuals counted for each species, separated by commas — for example 40, 30, 20, 10. The calculator finds the total number of individuals, converts each count into a proportion, and applies the Shannon formula. It also reports the number of species (\(S\)), the total count (\(N\)), and Pielou's evenness (\(J\)), which scales \(H\) between 0 and 1.
The formula explained
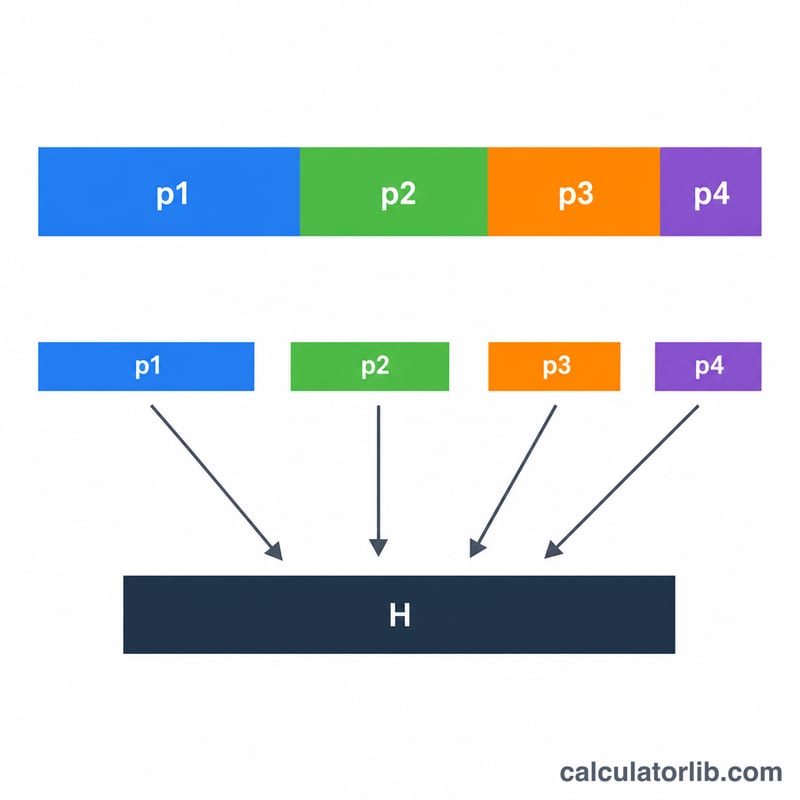
For each species \(i\), the proportion is \(p_i = n_i / N\), where \(n_i\) is that species' count and \(N\) is the grand total. The index is then:
$$H = -\sum_{i=1}^{S} p_i \ln p_i$$
This calculator uses the natural logarithm (\(\ln\)), so \(H\) is expressed in "nats." Evenness is \(J = H / \ln(S)\).
Worked example
Suppose you count four species: 40, 30, 20, and 10 individuals (\(N = 100\)). The proportions are 0.4, 0.3, 0.2, 0.1. Then $$H = -(0.4\cdot\ln 0.4 + 0.3\cdot\ln 0.3 + 0.2\cdot\ln 0.2 + 0.1\cdot\ln 0.1) \approx 1.2799.$$ With \(S = 4\), \(\ln(4) = 1.3863\), so evenness \(J \approx 0.923\) — a fairly even community.
Comparing Diversity Across Example Communities
The table below applies H = −Σ pi ln pi (natural log, so H is in nats) and Pielou's evenness J = H / ln(S) to five example communities. S is the number of species and N is the total number of individuals.
| Community (counts) | S | N | H (nats) | Pielou's J |
|---|---|---|---|---|
| 50 (one species) | 1 | 50 | 0.0000 | undefined (ln 1 = 0); usually reported as 0 or left blank |
| 25, 25, 25, 25 | 4 | 100 | 1.3863 | 1.000 |
| 40, 30, 20, 10 | 4 | 100 | 1.2799 | 0.923 |
| 90, 5, 3, 2 (dominated) | 4 | 100 | 0.4280 | 0.309 |
| 10 species, 10 each | 10 | 100 | 2.3026 | 1.000 |
Worked check for 40, 30, 20, 10 (p = 0.4, 0.3, 0.2, 0.1):
\(H = -(0.4\ln 0.4 + 0.3\ln 0.3 + 0.2\ln 0.2 + 0.1\ln 0.1) = 0.3665 + 0.3612 + 0.3219 + 0.2303 = 1.2799\)
\(J = 1.2799 / \ln 4 = 1.2799 / 1.3863 = 0.923\)
Worked check for 90, 5, 3, 2 (p = 0.90, 0.05, 0.03, 0.02):
\(H = 0.0948 + 0.1498 + 0.1052 + 0.0782 = 0.4280\), so \(J = 0.4280 / 1.3863 = 0.309\).
The dominated community has the same four species as the even one, but its H is less than a third as large because one species makes up 90% of individuals.
Interpreting Your Shannon Index and Evenness
- Range of H: H = 0 means only one species is present. For S species, H is at most ln(S), reached only when all species are equally abundant. For example, the maximum is ln 4 = 1.3863 for four species and ln 10 = 2.3026 for ten.
- Pielou's evenness J = H / ln(S): J close to 0 means the community is dominated by one or a few species. J close to 1 means individuals are spread nearly equally among species. J depends on S, so it tells you about evenness but not about richness.
- Effective number of species: exp(H) is the number of equally abundant species that would give the same H. For the 40, 30, 20, 10 community, exp(1.2799) ≈ 3.60, which is below the actual 4 species. For 90, 5, 3, 2, exp(0.4280) ≈ 1.53, so the community behaves like about 1.5 equally common species.
- Sample size and effort: H is estimated from a sample. It tends to increase with more individuals counted and more sampling effort, because rare species are more likely to be found. Compare communities only when they were sampled in a similar way.
- Log base matters: This calculator uses the natural log, so H is in nats. Using log2 gives bits, and log10 gives bans (dits). Convert with \(H_{\text{bits}} = H_{\text{nats}} / \ln 2\) (≈ divide by 0.6931) and \(H_{\text{nats}} = H_{\text{bits}} \times \ln 2\). For example, 1.2799 nats ≈ 1.846 bits. Values computed with different bases should not be compared directly.
- Zero counts: Species with a count of zero contribute nothing to H, because p ln p tends to 0 as p tends to 0. They should not be counted in S when computing J.
There is no universal threshold for "high" or "low" diversity. What counts as high depends on the taxon, habitat and method, so use H mainly to compare similar samples.
FAQ
What is a "good" H value? \(H\) usually ranges from about 1.5 to 3.5 in real ecosystems; values above 3 indicate very high diversity. There is no fixed maximum because it depends on richness.
Should I use ln or log10? Both are used in the literature. This tool uses the natural log (\(\ln\)), the most common convention. Results in different log bases differ by a constant factor.
What does evenness tell me? Pielou's evenness \(J\) ranges from 0 to 1. A value near 1 means individuals are spread almost equally across species; a low value signals dominance by a few species.