What Is the Wind Turbine Profit Calculator?
This tool estimates the yearly profit of a wind turbine installation. It takes the energy the turbine generates over a year, the price you receive per kilowatt-hour (kWh) of electricity, and your annual operating and maintenance costs, then returns gross revenue, net profit, and your profit margin. It is a quick way to gauge whether a turbine or wind farm makes financial sense.
How to Use It
Enter three numbers: the annual energy output in kWh (a typical onshore commercial turbine produces 3–7 million kWh per year), the price per kWh you sell or save at, and your annual operating cost (maintenance, land lease, insurance, grid fees). Click calculate to see profit and margin.
The Formula Explained
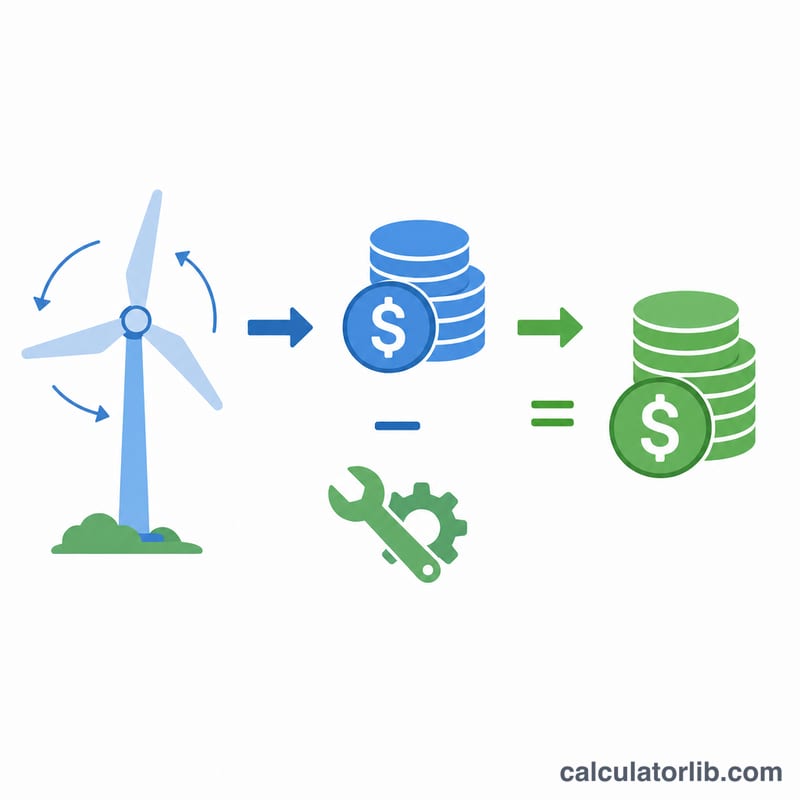
The calculation is straightforward: $$\text{Profit} = \text{Energy} \times \text{Price} - \text{Operating Cost}$$ Gross revenue is energy output multiplied by the price per kWh. Subtracting the annual operating cost yields net profit. Margin is profit divided by revenue, shown as a percentage, which tells you how much of every revenue dollar you keep.
Worked Example
Suppose a turbine generates 4,000,000 kWh per year, sold at $0.12/kWh, with $45,000 in annual operating costs. Gross revenue is $$4{,}000{,}000 \times 0.12 = \$480{,}000$$ Subtracting costs gives a profit of $$\$480{,}000 - \$45{,}000 = \$435{,}000$$ The margin is $$435{,}000 \div 480{,}000 \times 100 \approx 90.6\%$$
Typical Wind Turbine Output, Prices and Operating Costs
The figures below are broad, general ranges. Real values vary by region, year, turbine model and data source (for example IRENA, NREL and IEA publish regularly updated figures), so use them as starting points and replace them with your own site data.
Annual energy output
$$\text{Annual energy (kWh)} = \text{Rated power (kW)} \times 8{,}760\ \text{h} \times \text{Capacity factor}$$
Capacity factor is the share of the theoretical maximum output actually produced over a year. Typical values are roughly 25–45% for onshore wind and roughly 40–55% for offshore wind. Small turbines often fall lower, around 10–25%, because of lower hub heights and more turbulent sites.
| Turbine class | Rated power | Assumed capacity factor | Annual energy |
|---|---|---|---|
| Small | 10 kW | 20% | \(10 \times 8{,}760 \times 0.20 = 17{,}520\) kWh |
| Mid-size | 1.5 MW (1,500 kW) | 30% | \(1{,}500 \times 8{,}760 \times 0.30 = 3{,}942{,}000\) kWh |
| Mid-size | 2 MW (2,000 kW) | 35% | \(2{,}000 \times 8{,}760 \times 0.35 = 6{,}132{,}000\) kWh |
| Large | 3 MW (3,000 kW) | 40% | \(3{,}000 \times 8{,}760 \times 0.40 = 10{,}512{,}000\) kWh |
| Large | 5 MW (5,000 kW) | 45% | \(5{,}000 \times 8{,}760 \times 0.45 = 19{,}710{,}000\) kWh |
Electricity price per kWh
- Wholesale / power purchase agreements: commonly in the range of about $0.02–0.08 per kWh in many markets, but spot prices can swing well outside this band.
- Retail (avoided cost for self-consumption): often about $0.10–0.35 per kWh depending on country and tariff, which is why small turbines that offset retail power look better per kWh than those selling at wholesale.
- Feed-in tariffs and subsidies: highly country- and year-specific; check your local scheme and whether it is still open for new projects.
Operating and maintenance (O&M) costs
- Large onshore turbines: often roughly $0.01–0.03 per kWh, or on the order of $30–50 per kW per year in published assessments.
- Offshore wind: typically higher because of access, vessels and marine conditions, often several times the per-kW onshore level.
- Small turbines: O&M per kWh is usually higher because of scale; inspections, insurance and repairs are spread over little output.
Remember to include land lease, insurance, grid fees, and management costs in the operating-cost input if they apply to your project.
Scenario Comparison: Profit Under Different Conditions
All scenarios use a 2 MW turbine (2,000 kW × 8,760 h) with the formula \(\text{Profit} = \text{Energy} \times \text{Price} - \text{Operating cost}\) and \(\text{Margin} = \text{Profit} \div \text{Revenue}\). The prices and costs are illustrative assumptions, not forecasts.
| Scenario | Capacity factor | Energy (kWh/yr) | Price ($/kWh) | Operating cost ($/yr) | Revenue ($/yr) | Profit ($/yr) | Margin |
|---|---|---|---|---|---|---|---|
| Low-wind site | 25% | 4,380,000 | 0.05 | 80,000 | 219,000 | 139,000 | 63.5% |
| Average site | 35% | 6,132,000 | 0.06 | 90,000 | 367,920 | 277,920 | 75.5% |
| High-wind site | 45% | 7,884,000 | 0.06 | 100,000 | 473,040 | 373,040 | 78.9% |
| High-cost, low-price case | 25% | 4,380,000 | 0.04 | 200,000 | 175,200 | -24,800 | -14.2% |
Example substitution for the average site: \(6{,}132{,}000 \times 0.06 - 90{,}000 = 367{,}920 - 90{,}000 = 277{,}920\), and \(277{,}920 \div 367{,}920 \approx 75.5\%\).
The last row shows that a moderate wind resource combined with a low price and high operating cost can push the result below zero.
FAQ
Does this include the purchase price of the turbine? No — this estimates annual operating profit, not lifetime return on investment. For payback period, divide turbine cost by annual profit.
What energy output should I use? Use a realistic annual figure based on the turbine's rated capacity and your site's capacity factor (often 25–45%), not nameplate maximum.
Can I use it for solar or other generators? Yes — any generator with an energy output, sale price, and operating cost works with this formula.