
What is the Process Capability Index (Cp, Cpk)?
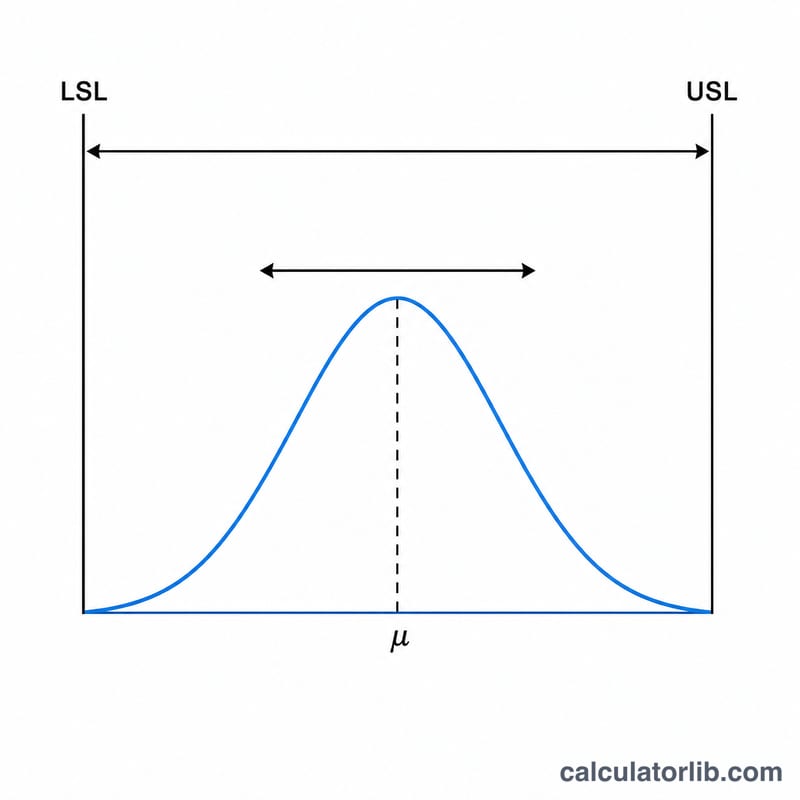
Cp and Cpk are core metrics in Statistical Process Control (SPC) and quality engineering. They compare the natural spread of a manufacturing process (six standard deviations of its output) against the engineering specification window defined by a lower specification limit (LSL) and an upper specification limit (USL). This is a universal statistical tool with no country-specific rules.
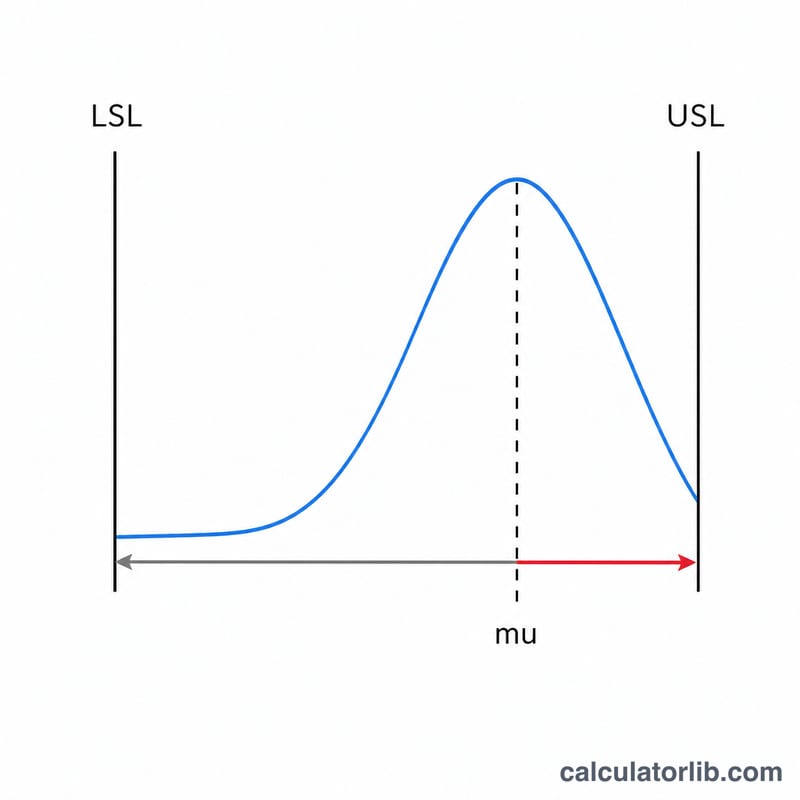
Cp describes the potential capability assuming the process is perfectly centered. Cpk describes the actual capability by also penalizing any offset of the process mean from the center of the spec window.
How to use this calculator
Paste or type your measured data values into the Data field, separated by commas, spaces, tabs or new lines. Enter the lower and upper specification limits in the same unit as your data. The calculator parses the list, computes the mean, variance, standard deviation, 3 sigma and 6 sigma, and then derives Cp and Cpk.
The formula explained
For data x₁..xₙ the mean is \(\mu = \frac{\sum x_i}{n}\). The population variance is \(\frac{\sum (x_i - \mu)^2}{n}\) and \(\sigma\) is its square root. Then:
$$C_p = \frac{\text{USL} - \text{LSL}}{6\,\sigma} \qquad C_{pk} = \min\!\left( \frac{\text{USL} - \mu}{3\,\sigma},\; \frac{\mu - \text{LSL}}{3\,\sigma} \right)$$Note this tool uses the population standard deviation (divide by n) so \(\sigma\) feeds the capability formulas consistently.
Worked example
Data = 45, 46, 44, 47, 43, 48, 45, 46, 44, 47 (n = 10), LSL = 40, USL = 50. Sum = 455, so \(\mu = 45.5\). The sum of squared deviations is 22.5, giving variance = 2.25 and \(\sigma = 1.5\). Then \(3\sigma = 4.5\), \(6\sigma = 9.0\).
$$C_p = \frac{10}{9} \approx 1.1111$$$$C_{pk} = \min\!\left[ \frac{50 - 45.5}{4.5},\; \frac{45.5 - 40}{4.5} \right] = \min[1.0,\; 1.2222] = 1.0$$FAQ
What is a good Cpk value? A value of 1.33 (corresponding to \(\pm 4\sigma\)) is a common target. Values below 1.0 indicate the process cannot reliably meet specification.
Why are Cp and Cpk different? Cp ignores centering, while Cpk drops as the process mean drifts away from the midpoint of the spec window. Cpk is always less than or equal to Cp.
What if all values are identical? Then \(\sigma = 0\) and the capability is mathematically infinite (zero variation), so this tool returns 0 as a guard against dividing by zero.