What this calculator does
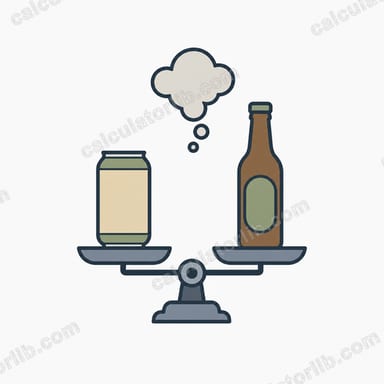
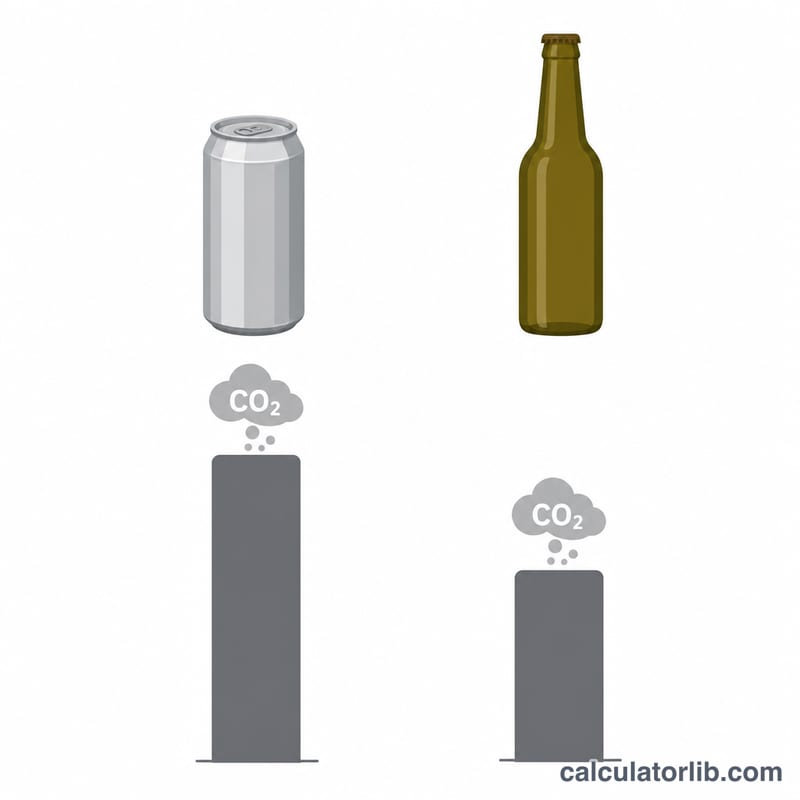
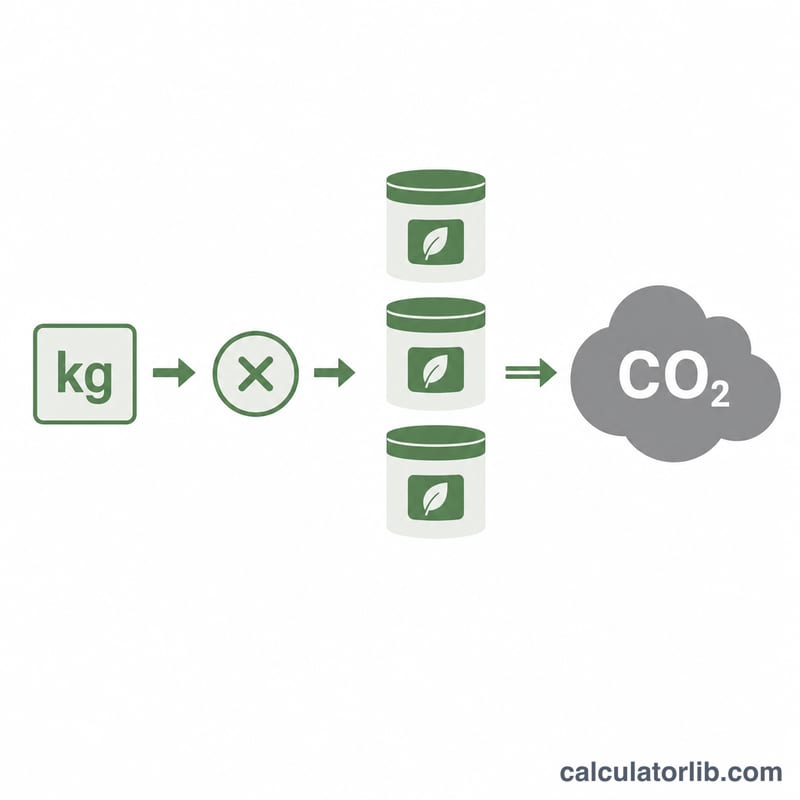
This tool compares the life-cycle carbon dioxide (CO2) emissions of a 500 ml aluminum beer can against a 500 ml glass beer bottle. You enter a per-container emission factor for each (in kg-CO2) and the number of containers, and the calculator reports the total emissions of each in grams plus the difference between them. The math is universal: \(\text{total emissions} = \text{factor} \times \text{count}\).
Where the default factors come from
The bundled defaults (0.12246 kg per aluminum can and 0.0619 kg per glass bottle) are illustrative values derived from a Japanese Ministry of the Environment packaging life-cycle assessment study. They assume a 500 ml can weighing 19.27 g with a 93.3% recycling rate, and a 500 ml refillable glass bottle weighing 473.41 g that is washed and reused on average 25.6 times at a 100% return rate. Because heavy glass bottles are reused many times while aluminum cans are melted down and remade, the per-trip footprint of the reusable bottle comes out lower in this dataset. These figures are region-specific and editable, so you can plug in your own local LCA data.
How to use it
Keep the default factors or replace them with your own, set the number of containers, and read the results. All outputs are shown in grams of CO2 (the kg factors are multiplied by 1000 internally).
Worked example
Using the defaults with one container: the can emits $$0.12246 \times 1000 \times 1 = 122.46 \text{ g},$$ the bottle emits $$0.0619 \times 1000 \times 1 = 61.9 \text{ g},$$ and the difference is $$122.46 - 61.9 = 60.56 \text{ g}.$$ For a six-pack (count = 6): can = 734.76 g, bottle = 371.4 g, difference = 363.36 g.
Typical CO2 Emission Factors for Beverage Containers
The values below are illustrative life-cycle assessment (LCA) figures for a single 500 ml beverage container, expressed in kilograms of CO₂-equivalent per container. They bundle together raw-material production, container manufacture, filling, transport and end-of-life processing. Real numbers vary widely between studies, countries and even individual breweries, so treat these as starting points to be edited rather than fixed truths. The default factors in this calculator (aluminum can vs. single-use glass bottle) are drawn from a Japanese LCA study; the additional rows are representative ranges reported in the broader packaging-LCA literature.
| Container (500 ml) | Approx. empty weight | Illustrative kg CO₂e / container | Recycling / reuse assumption |
|---|---|---|---|
| Aluminum can | ≈14–16 g | 0.12 – 0.34 | Partial recycled-content aluminum; recycling rate strongly affects result |
| Single-use glass bottle | ≈300–400 g | 0.30 – 0.55 | One-trip bottle; cullet recycling assumed but no reuse |
| Refillable glass bottle | ≈350–450 g | 0.05 – 0.25 (per trip) | Heavier bottle amortized over many refills (e.g. 15–30 trips); short transport distance |
| PET plastic bottle | ≈20–30 g | 0.08 – 0.20 | Lightweight; recycled-PET content and recycling rate dependent |
Because aluminum and glass production are energy-intensive, the electricity and heat mix used in manufacturing is one of the largest single drivers of these numbers. A factor measured in a region with low-carbon electricity can be a fraction of the same container's footprint made on a coal-heavy grid. When you enter your own factors, make sure both the can and bottle values share the same system boundary (same stages included) so the comparison is fair.
FAQ
Why is the bottle lower than the can? In this dataset the glass bottle is refillable and reused about 25.6 times, spreading its large manufacturing footprint across many uses, while the can is single-use before recycling.
What does a negative difference mean? If you enter a bottle factor larger than the can factor, the difference becomes negative, meaning the bottle emits more for that count.
Can I use this outside Japan? Yes. The formula is generic multiplication; just replace the default factors with emission data that reflects your own region's energy mix and recycling rates.