
What Is the Mid Range Calculator?
The Mid Range Calculator finds the midpoint between the smallest and largest values in any set of numbers you provide. The mid range is one of the simplest measures of central tendency in statistics — unlike the mean or median, it depends only on the two extreme values of your dataset. This makes it a quick way to estimate where the "centre" of your data sits based purely on its range. The tool also plots your numbers on a line chart so you can visually see how they spread around that midpoint.
How to Use It
There is a single input field: Enter numbers (comma-separated). Simply type your values separated by commas, for example 4, 8, 15, 16, 23, 42. The calculator splits the text on each comma, trims any spaces, and converts each entry to a number. It then identifies the minimum and maximum values and computes the mid range. A line chart and a marked mid-range line are generated automatically so you can see the result in context.
The Formula Explained
The mid range uses only two numbers — the lowest and the highest in your set:
- Minimum = the smallest value in the list
- Maximum = the largest value in the list
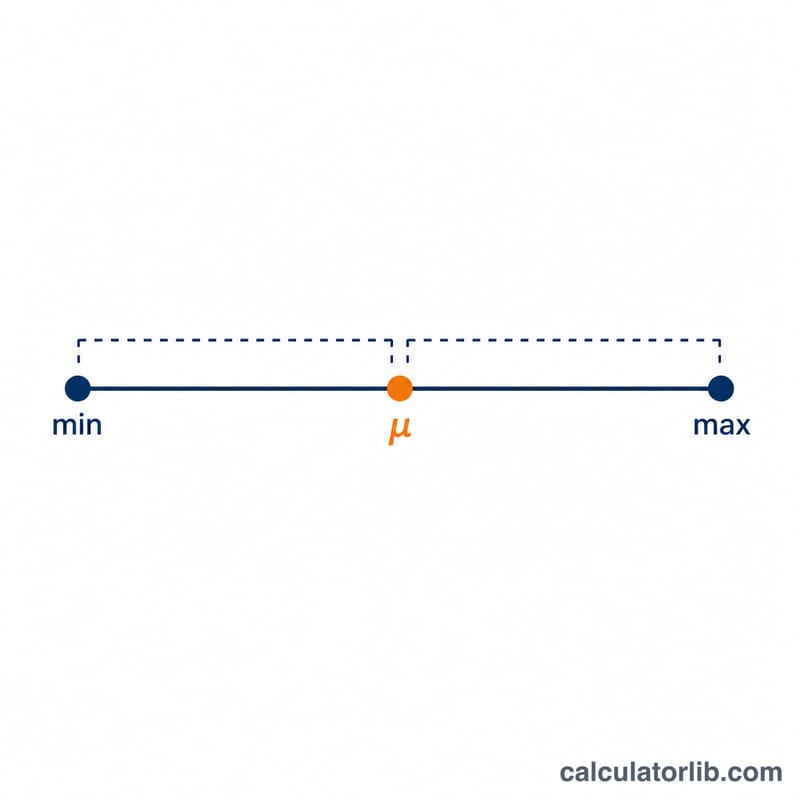
- Mid Range = (Minimum + Maximum) ÷ 2
$$\text{Mid-Range} = \frac{\min(\text{Numbers}) + \max(\text{Numbers})}{2}$$
Notice that values in between have no effect on the result. The chart additionally scales each point relative to the range (Maximum − Minimum) so every data point fits neatly between the axis limits.
Worked Example
Suppose you enter: 4, 8, 15, 16, 23, 42.
- Minimum = 4
- Maximum = 42
- Mid Range = $$(4 + 42) \div 2 = 46 \div 2 = \mathbf{23}$$
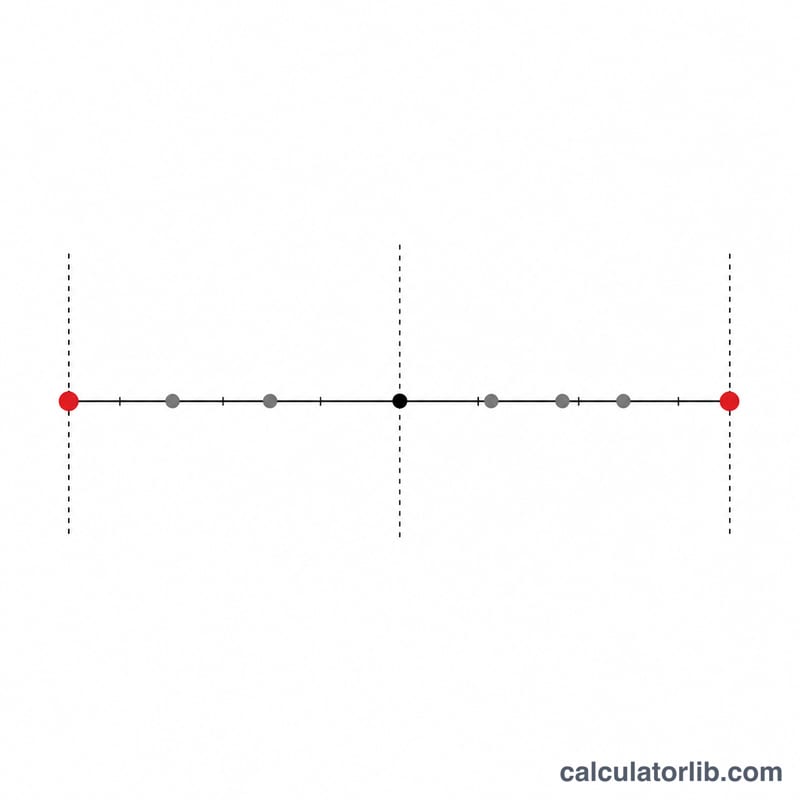
Even though the dataset has six numbers, only 4 and 42 determine the result. The mid range of 23 lies exactly halfway between the smallest and largest values.
Frequently Asked Questions
How is the mid range different from the mean? The mean (average) sums every value and divides by the count, so all numbers matter. The mid range averages only the minimum and maximum, ignoring everything in between.
Is the mid range affected by outliers? Yes, heavily. Because it relies entirely on the two extreme values, a single very high or very low number can shift it significantly. For skewed data, the median is often more reliable.
Can I enter decimals or negative numbers? Yes. The calculator parses each comma-separated value as a number, so decimals (e.g. 3.5) and negatives (e.g. -7) are fully supported.