What is the Quartile and IQR Calculator?
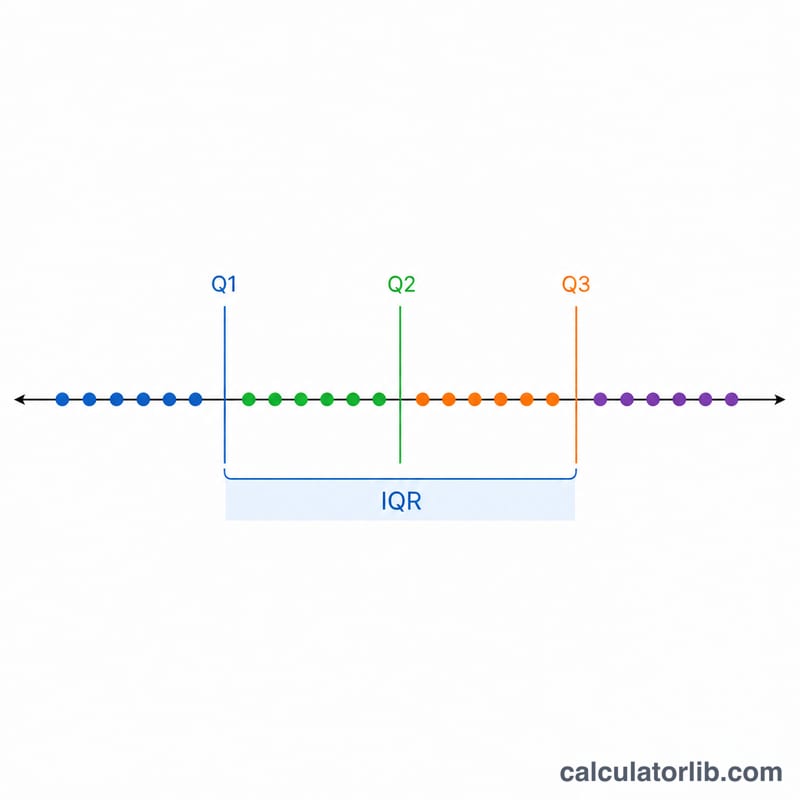
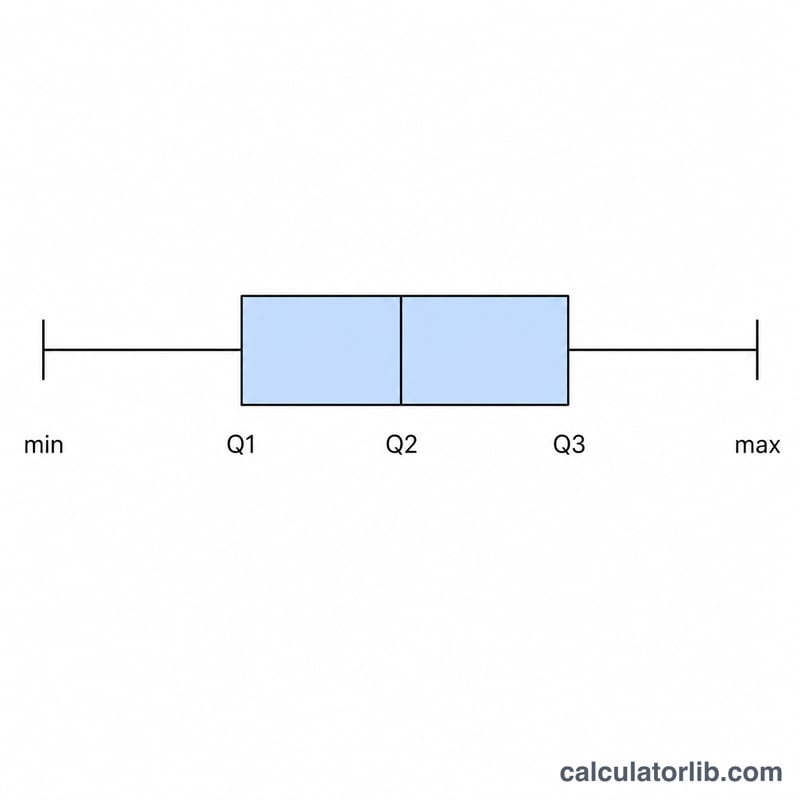
This tool sorts your data set and computes the three quartiles — Q1 (25th percentile), Q2 (the median, 50th percentile) and Q3 (75th percentile) — along with the interquartile range (IQR), minimum, maximum and range. Quartiles divide an ordered data set into four equal parts, and the IQR captures the spread of the central 50% of values, making it a robust measure of dispersion that is not influenced by extreme outliers.
How to use it
Type or paste your numbers into the box, separated by commas or spaces (for example 3, 7, 8, 5, 12, 14, 21, 13, 18). The calculator automatically sorts them and reports Q1, Q2, Q3 and IQR instantly. You can mix integers and decimals; the order you enter values in does not matter.
The formula explained
The values are first sorted in ascending order. The median (Q2) splits the data into a lower and an upper half. This calculator uses the exclusive (Tukey) method: when the count is odd, the central value is excluded from both halves. Q1 is the median of the lower half and Q3 is the median of the upper half. Finally, $$\text{IQR} = Q_3 - Q_1$$.
Worked example
Take the data set 3, 5, 7, 8, 12, 13, 14, 18, 21 (\(n = 9\), already sorted). The median Q2 is the 5th value, 12. The lower half is 3, 5, 7, 8, whose median is $$(5 + 7) / 2 = 6,$$ so \(Q_1 = 6\). The upper half is 13, 14, 18, 21, whose median is $$(14 + 18) / 2 = 16,$$ so \(Q_3 = 16\). Therefore $$\text{IQR} = 16 - 6 = 10.$$
FAQ
What does the IQR tell me? It measures how spread out the middle 50% of your data is. A larger IQR means more variability in the central values.
How is the IQR used to detect outliers? A common rule flags any value below \(Q_1 - 1.5 \times \text{IQR}\) or above \(Q_3 + 1.5 \times \text{IQR}\) as a potential outlier.
Why might my result differ from a spreadsheet? Different software uses different quartile methods. This calculator uses the exclusive median method; tools like Excel QUARTILE.INC use linear interpolation, which can give slightly different Q1/Q3 values.


