
What is a quartile?
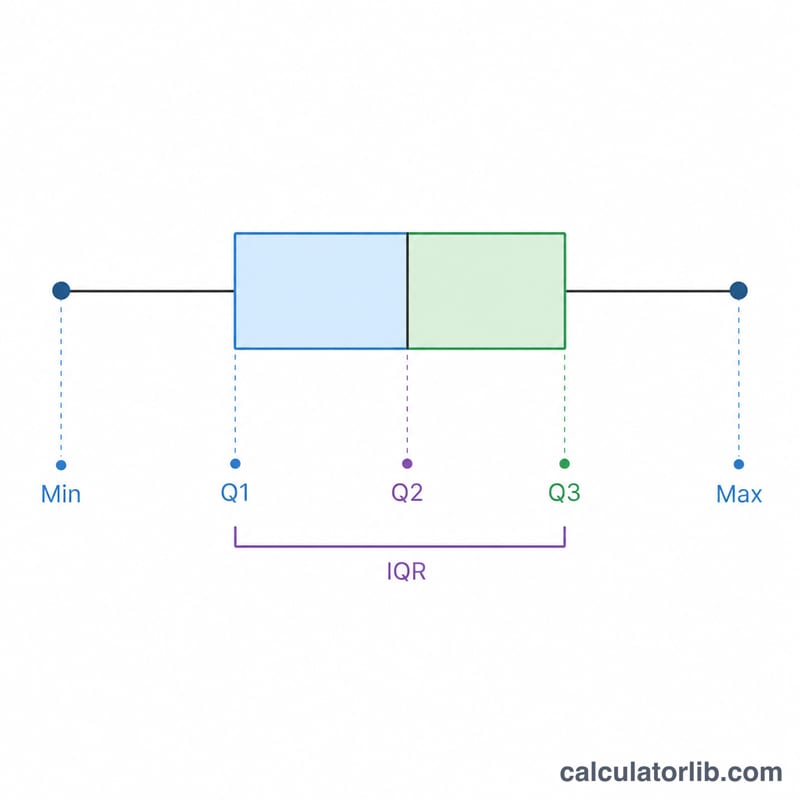
Quartiles split a sorted data set into four equal parts. The first quartile (Q1) marks the 25th percentile — 25% of values fall below it. The second quartile (Q2) is the median, the 50th percentile. The third quartile (Q3) is the 75th percentile. Together they summarise where the bulk of your data sits and how spread out it is.

How to use this calculator
Type your numbers into the box separated by commas or spaces (e.g. 3, 7, 8, 5, 12) and submit. The calculator sorts the values automatically, so order does not matter. It returns Q1, Q2, Q3, the interquartile range (\(IQR = Q_3 - Q_1\)), plus the minimum, maximum and count for context.
The formula explained
This tool uses the linear-interpolation method (the same one used by many statistics packages). For percentile p, it finds the rank position \(r = \tfrac{p}{100}(n-1)\) on the zero-indexed sorted list, where n is the count.
$$Q_p = x_{\lfloor r \rfloor} + (r - \lfloor r \rfloor)\,(x_{\lceil r \rceil} - x_{\lfloor r \rfloor}),\quad r = \tfrac{p}{100}(n-1)$$
If r is a whole number, the quartile is that exact value; otherwise it interpolates between the two neighbouring values in proportion to the fractional part.
Worked example
Take the data set 3, 7, 8, 5, 12, 14, 21, 13, 18. Sorted: 3, 5, 7, 8, 12, 13, 14, 18, 21 (\(n = 9\)). For Q1, \(r = 0.25 \times 8 = 2\), giving the value at index 2 = 7. For Q2, \(r = 0.5 \times 8 = 4\), value at index 4 = 12. For Q3, \(r = 0.75 \times 8 = 6\), value at index 6 = 14. So \(Q_1 = 7\), \(Q_2 = 12\), \(Q_3 = 14\) and $$IQR = 14 - 7 = 7.$$
FAQ
Why might my answer differ from another calculator? Several quartile methods exist (e.g. inclusive vs exclusive median). This tool uses linear interpolation on \((n - 1)\), which is widely used and matches NumPy's default and many spreadsheet PERCENTILE functions.
What is the IQR used for? The interquartile range measures the spread of the middle 50% of values and is the basis for detecting outliers (values below \(Q_1 - 1.5\cdot IQR\) or above \(Q_3 + 1.5\cdot IQR\)).
Can I enter decimals or negative numbers? Yes — any real numbers work, separated by commas or spaces.