What Is the First Quartile (Q1)?
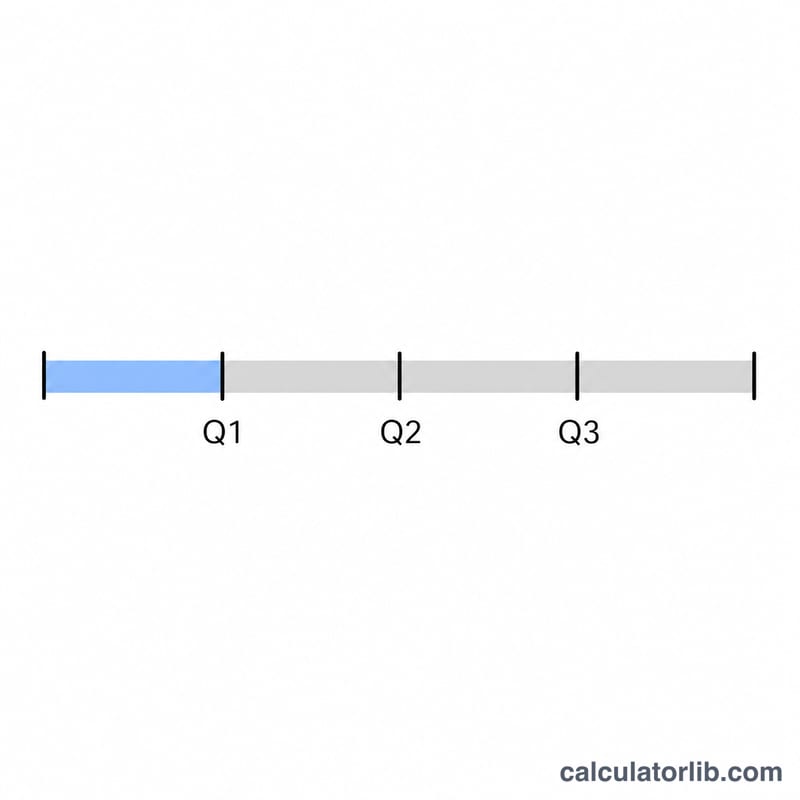
The first quartile, often written as Q1, is the value that separates the lowest 25% of a data set from the rest. It is also called the 25th percentile. Together with the median (Q2) and the third quartile (Q3), it helps describe how data is spread out. Q1 is widely used in box plots, outlier detection, and summary statistics.
How to Use This Calculator
Type your numbers into the box, separated by commas or spaces (for example 4, 8, 15, 16, 23, 42). The calculator sorts the values, finds the Q1 position using the \((n+1)/4\) rule, and interpolates between neighboring values when the position falls between two ranks.
The Formula Explained
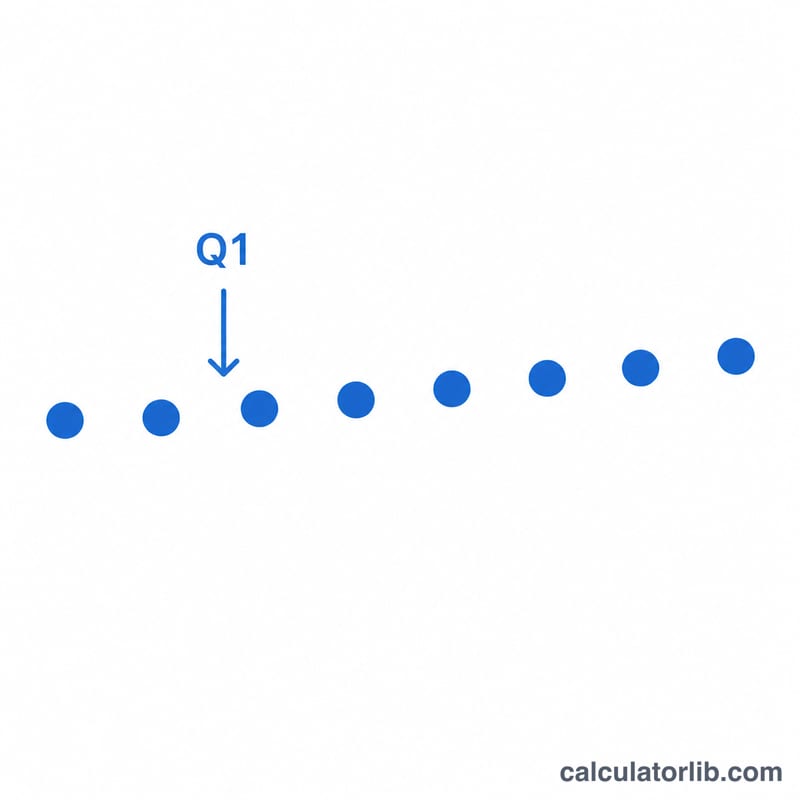
First the data is sorted in ascending order. The position of Q1 is calculated as \(L = (n + 1) / 4\), where \(n\) is the number of values. If \(L\) is a whole number, Q1 is simply the value at that rank. If \(L\) is fractional, Q1 is found by linear interpolation:
$$Q_1 = x_{(\lfloor L \rfloor)} + (L - \lfloor L \rfloor)\left(x_{(\lceil L \rceil)} - x_{(\lfloor L \rfloor)}\right)$$Worked Example
Consider the data set 4, 8, 15, 16, 23, 42. There are \(n = 6\) values. The Q1 position is
$$L = \frac{6 + 1}{4} = 1.75$$The 1st value is 4 and the 2nd value is 8. Interpolating:
$$Q_1 = 4 + 0.75 \times (8 - 4) = 4 + 3 = 7$$So the first quartile is 7.
FAQ
Why might my answer differ from another calculator? There are several quartile methods. This tool uses the \((n+1)/4\) position method. Other methods (like the median-of-halves or exclusive/inclusive percentile methods) can give slightly different results.
Does the data need to be sorted first? No. The calculator sorts your numbers automatically before computing Q1.
What does Q1 tell me? It marks the boundary below which the smallest 25% of your data falls, giving insight into the lower spread of your distribution.


