What is the IQR Outlier Calculator?
This calculator analyzes a list of numbers and identifies statistical outliers using the well-known 1.5×IQR rule introduced by statistician John Tukey. It returns the first quartile (Q1), median (Q2), third quartile (Q3), the interquartile range (IQR), and the lower and upper "fences" that bracket the values considered normal. Any number outside those fences is flagged as a potential outlier.
How to use it
Enter your data values separated by commas or spaces (for example 2, 5, 7, 8, 10, 12, 14, 18, 21, 45) and submit. The tool sorts the numbers, computes the quartiles using linear interpolation (the same R-7 / Excel PERCENTILE method), and applies the fence formulas. Values smaller than the lower fence or larger than the upper fence are counted as outliers.
The formula explained
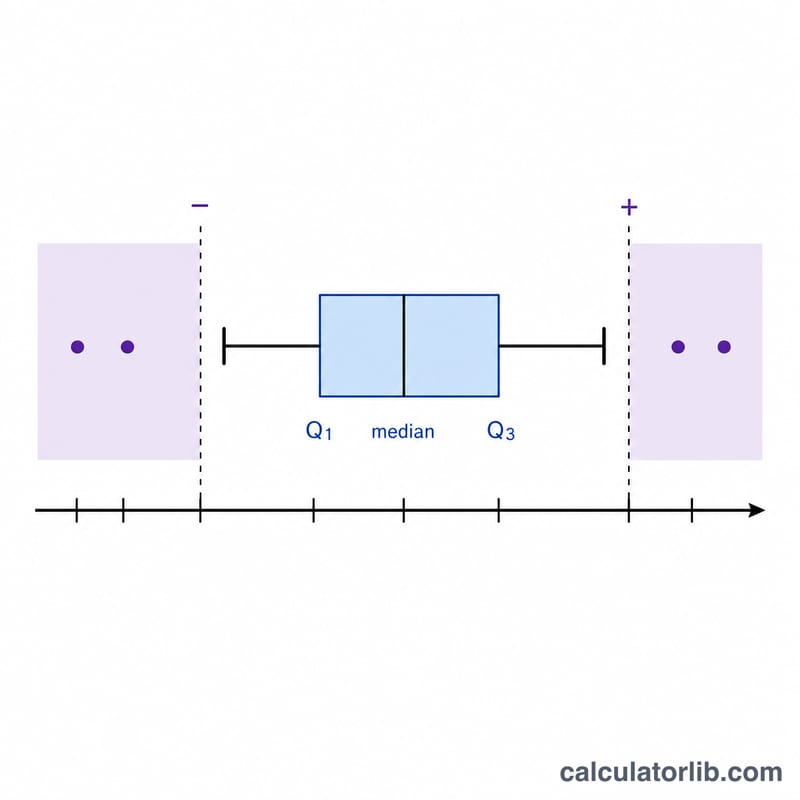
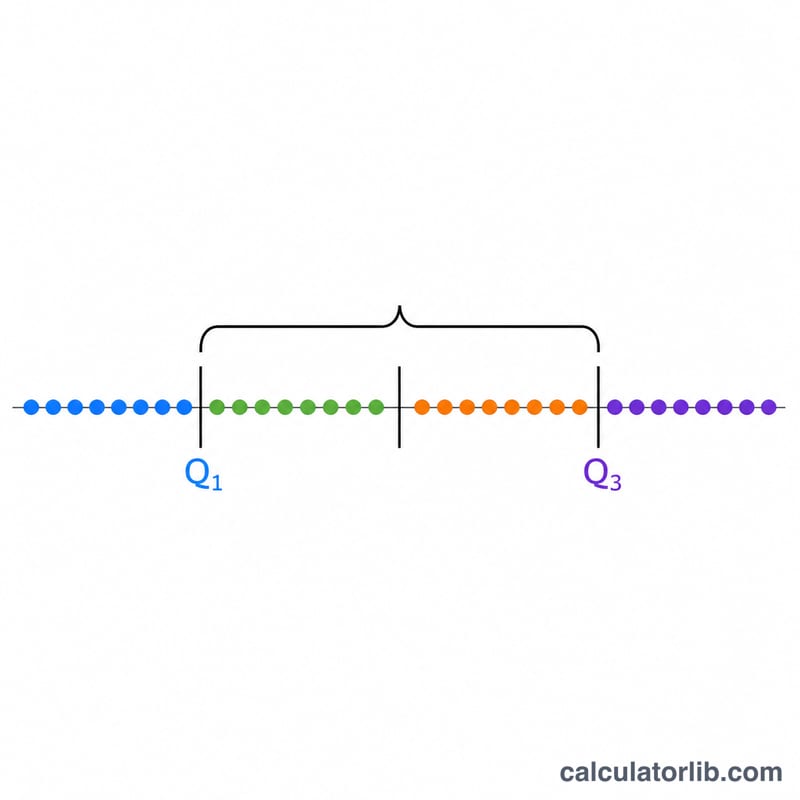
The interquartile range is the distance between the 25th and 75th percentiles: \(\text{IQR} = Q_3 - Q_1\). The fences extend 1.5 IQRs beyond the quartiles:
$$\begin{aligned} \text{Lower fence} &= Q_1 - 1.5 \cdot \text{IQR} \\ \text{Upper fence} &= Q_3 + 1.5 \cdot \text{IQR} \end{aligned}$$The factor 1.5 is the classic Tukey threshold; some analysts use 3.0 to flag only "far out" extreme values.
Worked example
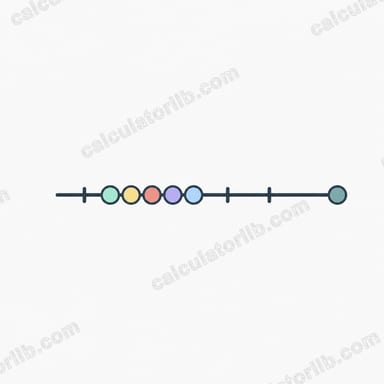
For the data set 2, 5, 7, 8, 10, 12, 14, 18, 21, 45 (\(n = 10\)): \(Q_1 = 7.25\), \(Q_3 = 17\), so \(\text{IQR} = 9.75\). Lower fence and upper fence:
$$\text{Lower fence} = 7.25 - 1.5 \times 9.75 = -7.375$$$$\text{Upper fence} = 17 + 1.5 \times 9.75 = 31.625$$The value 45 exceeds the upper fence, so it is the single outlier.
FAQ
Which quartile method is used? Linear interpolation between order statistics (R-7), matching Excel's PERCENTILE and QUARTILE functions.
Why 1.5? It is Tukey's conventional multiplier that balances sensitivity and false positives for roughly normal data.
Can fences be negative? Yes — a negative lower fence simply means no value on the low side is extreme enough to be an outlier.


